DP-203: Data Engineering on Microsoft Azure
You use Azure Stream Analytics to receive Twitter data from Azure Event Hubs and to output the data to an Azure Blob storage account.
You need to output the count of tweets from the last five minutes every minute.
Which windowing function should you use?
Sliding
Session
Tumbling
Hopping
Answer is Hopping
Hopping window functions hop forward in time by a fixed period.
Incorrect Answers:
A: Sliding windows, unlike Tumbling or Hopping windows, output events only for points in time when the content of the window actually changes. In other words, when an event enters or exits the window.
B: Session window functions group events that arrive at similar times, filtering out periods of time where there is no data. A session window begins when the first event occurs. If another event occurs within the specified timeout from the last ingested event, then the window extends to include the new event. Otherwise if no events occur within the timeout, then the window is closed at the timeout.
C: Tumbling window functions are used to segment a data stream into distinct time segments. A Tumbling windows do not overlap, and an event cannot belong to more than one tumbling window.
Reference:
https://docs.microsoft.com/en-us/azure/stream-analytics/stream-analytics-window-functions
You are implementing Azure Stream Analytics windowing functions.
Which windowing function should you use for each requirement?
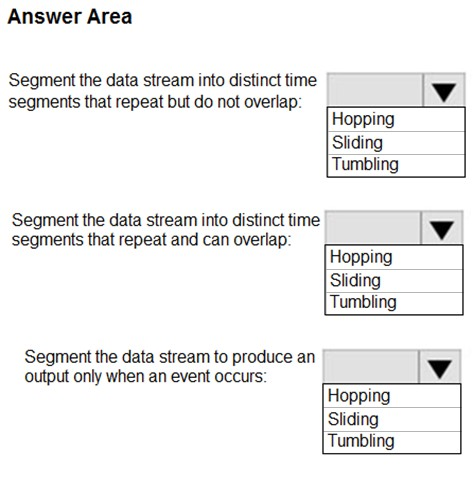
Check the answer section
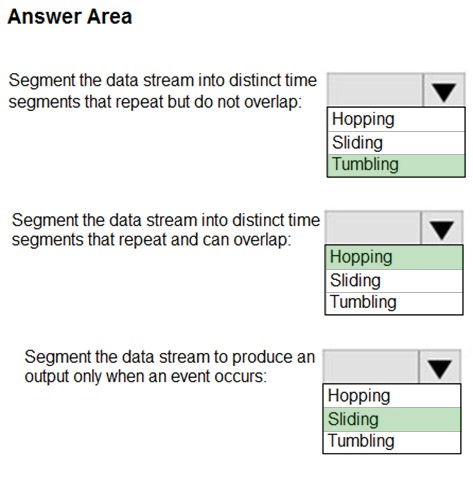
Box 1: Tumbling
Tumbling window functions are used to segment a data stream into distinct time segments and perform a function against them, such as the example below. The key differentiators of a Tumbling window are that they repeat, do not overlap, and an event cannot belong to more than one tumbling window.
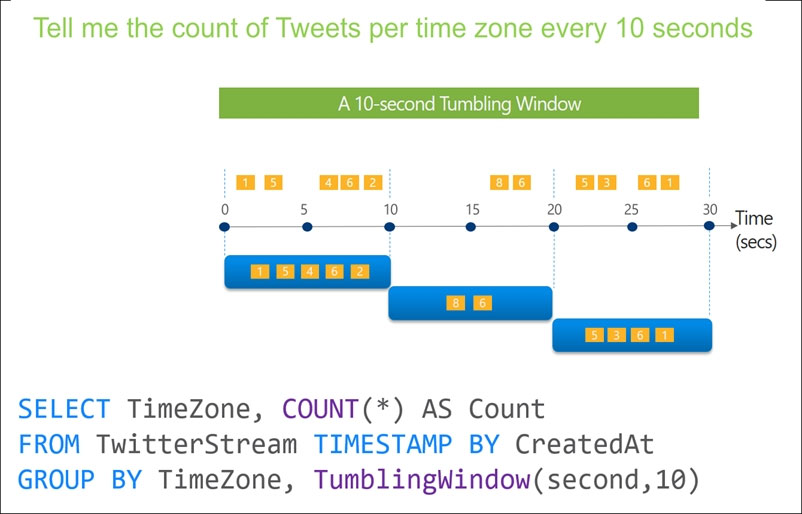
Box 2: Hopping
Hopping window functions hop forward in time by a fixed period. It may be easy to think of them as Tumbling windows that can overlap, so events can belong to more than one Hopping window result set. To make a Hopping window the same as a Tumbling window, specify the hop size to be the same as the window size.
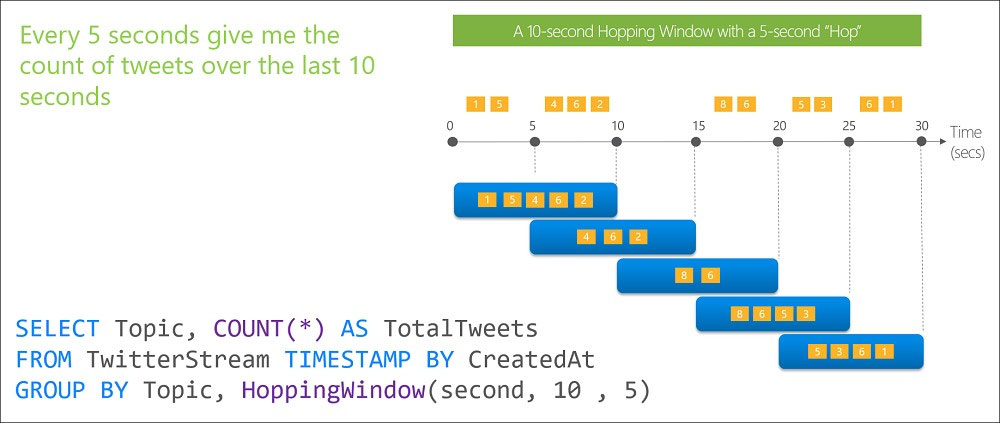
Box 3: Sliding
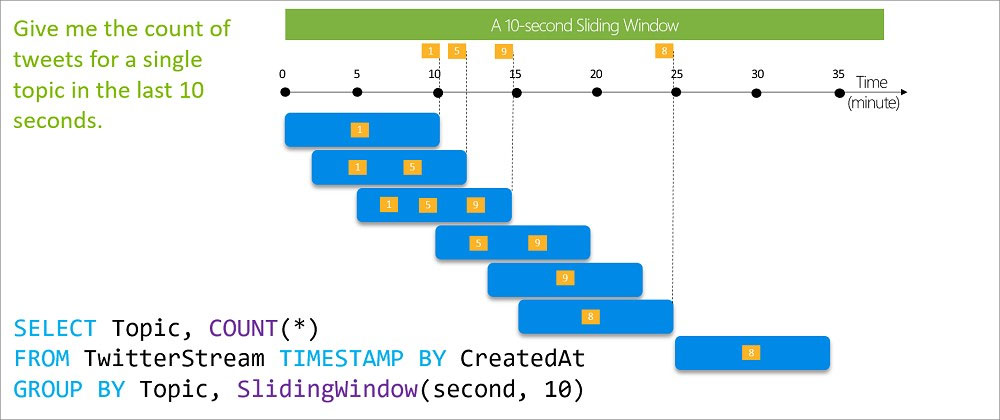
Sliding window functions, unlike Tumbling or Hopping windows, produce an output only when an event occurs. Every window will have at least one event and the window continuously moves forward by an (epsilon). Like hopping windows, events can belong to more than one sliding window.
Reference:
https://docs.microsoft.com/en-us/azure/stream-analytics/stream-analytics-window-functions
You have an Azure SQL database named Database1 and two Azure event hubs named HubA and HubB. The data consumed from each source is shown in the following table.
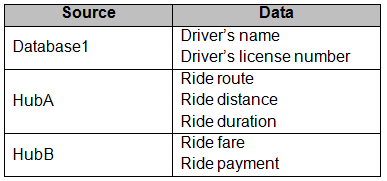
You need to implement Azure Stream Analytics to calculate the average fare per mile by driver.
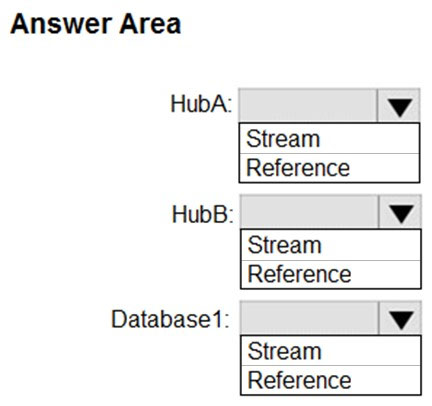
How should you configure the Stream Analytics input for each source?
Check the answer section
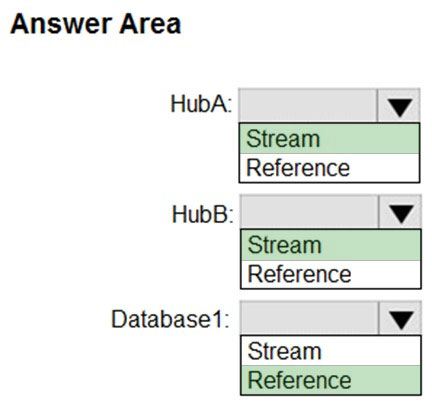
HubA: Stream
HubB: Stream
Database1: Reference
Reference data (also known as a lookup table) is a finite data set that is static or slowly changing in nature, used to perform a lookup or to augment your data streams. For example, in an IoT scenario, you could store metadata about sensors (which dont change often) in reference data and join it with real time IoT data streams. Azure Stream Analytics loads reference data in memory to achieve low latency stream processing
Reference:
https://docs.microsoft.com/en-us/azure/stream-analytics/stream-analytics-use-reference-data
You have an Azure Stream Analytics job that receives clickstream data from an Azure event hub.
You need to define a query in the Stream Analytics job. The query must meet the following requirements:
- Count the number of clicks within each 10-second window based on the country of a visitor.
- Ensure that each click is NOT counted more than once.
How should you define the query?
SELECT Country, Count(*) AS Count FROM ClickStream TIMESTAMP BY CreatedAt GROUP BY Country, TumblingWindow(second, 10)
SELECT Country, Count(*) AS Count FROM ClickStream TIMESTAMP BY CreatedAt GROUP BY Country, SessionWindow(second, 5, 10)
SELECT Country, Avg(*) AS Average FROM ClickStream TIMESTAMP BY CreatedAt GROUP BY Country, SlidingWindow(second, 10)
SELECT Country, Avg(*) AS Average FROM ClickStream TIMESTAMP BY CreatedAt GROUP BY Country, HoppingWindow(second, 10, 2)
Answer is SELECT Country, Count(*) AS Count FROM ClickStream TIMESTAMP BY CreatedAt GROUP BY Country, TumblingWindow(second, 10)
Tumbling window functions are used to segment a data stream into distinct time segments and perform a function against them, such as the example below. The key differentiators of a Tumbling window are that they repeat, do not overlap, and an event cannot belong to more than one tumbling window.
Incorrect Answers:
B: Session windows group events that arrive at similar times, filtering out periods of time where there is no data.
C: Sliding windows, unlike Tumbling or Hopping windows, output events only for points in time when the content of the window actually changes. In other words, when an event enters or exits the window. Every window has at least one event, like in the case of Hopping windows, events can belong to more than one sliding window.
D: Hopping window functions hop forward in time by a fixed period. It may be easy to think of them as Tumbling windows that can overlap, so events can belong to more than one Hopping window result set. To make a Hopping window the same as a Tumbling window, specify the hop size to be the same as the window size.
Reference:
https://docs.microsoft.com/en-us/azure/stream-analytics/stream-analytics-window-functions
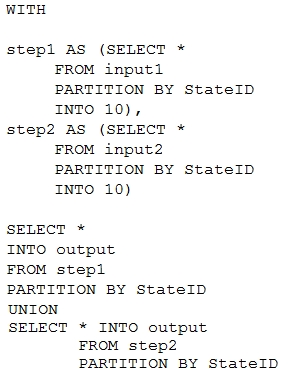
You have the following Azure Stream Analytics query.
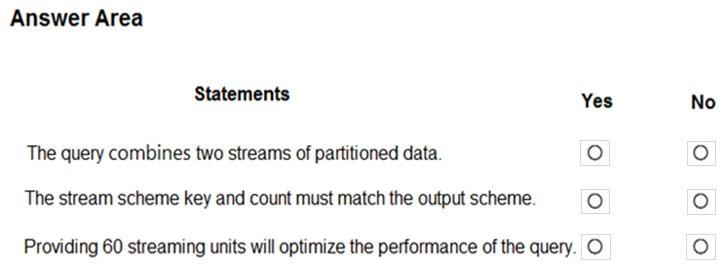
For each of the following statements, select Yes if the statement is true. Otherwise, select No.
Check the answer section
Box 1: Yes
You can now use a new extension of Azure Stream Analytics SQL to specify the number of partitions of a stream when reshuffling the data.
The outcome is a stream that has the same partition scheme. Please see below for an example:
WITH step1 AS (SELECT * FROM [input1] PARTITION BY DeviceID INTO 10), step2 AS (SELECT * FROM [input2] PARTITION BY DeviceID INTO 10) SELECT * INTO [output] FROM step1 PARTITION BY DeviceID UNION step2 PARTITION BY DeviceID
Note: The new extension of Azure Stream Analytics SQL includes a keyword INTO that allows you to specify the number of partitions for a stream when performing reshuffling using a PARTITION BY statement.
Box 2: Yes
When joining two streams of data explicitly repartitioned, these streams must have the same partition key and partition count.
Box 3: Yes
Streaming Units (SUs) represents the computing resources that are allocated to execute a Stream Analytics job. The higher the number of SUs, the more CPU and memory resources are allocated for your job.
In general, the best practice is to start with 6 SUs for queries that don't use PARTITION BY.
Here there are 10 partitions, so 6x10 = 60 SUs is good.
Note: Remember, Streaming Unit (SU) count, which is the unit of scale for Azure Stream Analytics, must be adjusted so the number of physical resources available to the job can fit the partitioned flow. In general, six SUs is a good number to assign to each partition. In case there are insufficient resources assigned to the job, the system will only apply the repartition if it benefits the job.
Reference:
https://azure.microsoft.com/en-in/blog/maximize-throughput-with-repartitioning-in-azure-stream-analytics/
https://docs.microsoft.com/en-us/azure/stream-analytics/stream-analytics-streaming-unit-consumption
You are designing a real-time dashboard solution that will visualize streaming data from remote sensors that connect to the internet. The streaming data must be aggregated to show the average value of each 10-second interval. The data will be discarded after being displayed in the dashboard.
The solution will use Azure Stream Analytics and must meet the following requirements:
- Minimize latency from an Azure Event hub to the dashboard.
- Minimize the required storage.
- Minimize development effort.
What should you include in the solution?
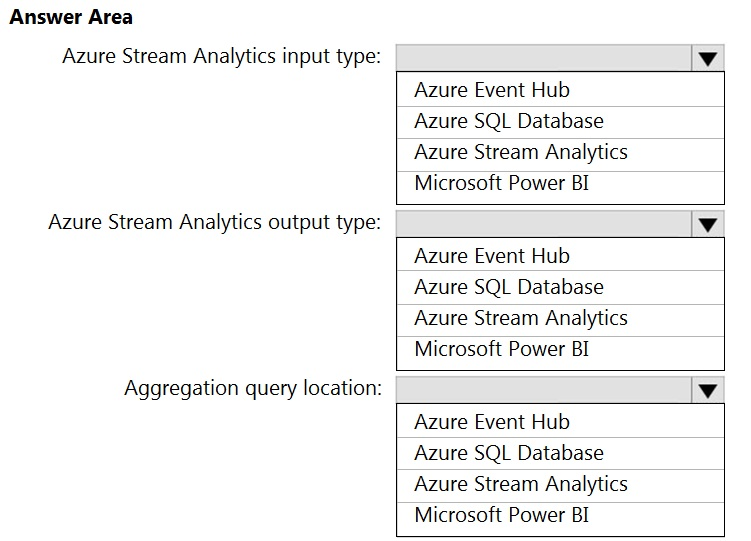
1. Azure Event Hub
2. Microsoft Power BI
3. Azure Stream Analytics
Reference:
https://docs.microsoft.com/en-us/azure/stream-analytics/stream-analytics-power-bi-dashboard
You have an Azure event hub named retailhub that has 16 partitions. Transactions are posted to retailhub. Each transaction includes the transaction ID, the individual line items, and the payment details. The transaction ID is used as the partition key.
You are designing an Azure Stream Analytics job to identify potentially fraudulent transactions at a retail store. The job will use retailhub as the input. The job will output the transaction ID, the individual line items, the payment details, a fraud score, and a fraud indicator.
You plan to send the output to an Azure event hub named fraudhub.
You need to ensure that the fraud detection solution is highly scalable and processes transactions as quickly as possible.
How should you structure the output of the Stream Analytics job?
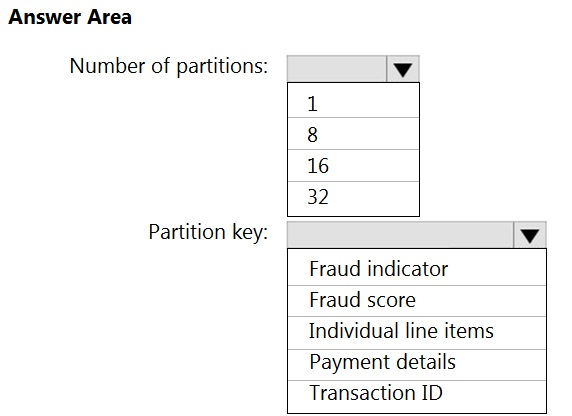
Box 1: 16
For Event Hubs you need to set the partition key explicitly.
An embarrassingly parallel job is the most scalable scenario in Azure Stream Analytics. It connects one partition of the input to one instance of the query to one partition of the output.
Box 2: Transaction ID
Reference:
https://docs.microsoft.com/en-us/azure/event-hubs/event-hubs-features#partitions
You are implementing an Azure Stream Analytics solution to process event data from devices. The devices output events when there is a fault and emit a repeat of the event every five seconds until the fault is resolved. The devices output a heartbeat event every five seconds after a previous event if there are no faults present.
A sample of the events is shown in the following table.

You need to calculate the uptime between the faults.
How should you complete the Stream Analytics SQL query? To answer, select the appropriate options in the answer area.
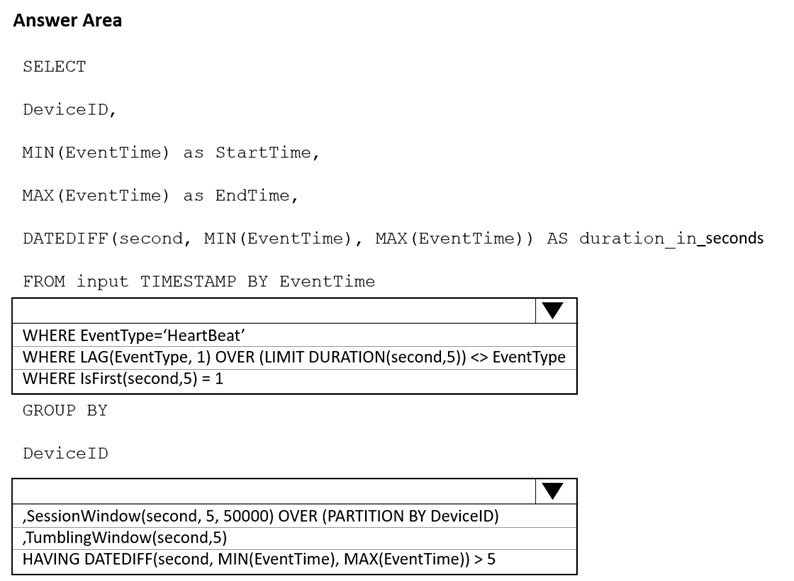
Answer is WHERE EventType='HeartBeat' and Session window.
If we want to calculate the uptime between the faults, we must use session window for each device, we know that will be receiving events for each 5 seconds if there is no error, so when an error occurs (or if we reach the maximum size of the window) then a new event will not be received within the next 5 seconds and the window will close, calculating the uptime. However if We use Tumbling window, it´s not possible to calculate the uptime beyond 5 seconds.
Reference:
https://docs.microsoft.com/en-us/stream-analytics-query/session-window-azure-stream-analytics
https://docs.microsoft.com/en-us/stream-analytics-query/tumbling-window-azure-stream-analytics
You plan to ingest streaming social media data by using Azure Stream Analytics. The data will be stored in files in Azure Data Lake Storage, and then consumed by using Azure Databricks and PolyBase in Azure Synapse Analytics.
You need to recommend a Stream Analytics data output format to ensure that the queries from Databricks and PolyBase against the files encounter the fewest possible errors. The solution must ensure that the files can be queried quickly and that the data type information is retained.
What should you recommend?
JSON
Parquet
CSV
Avro
Answer is Parquet
Need Parquet to support both Databricks and PolyBase.
Reference:
https://docs.microsoft.com/en-us/sql/t-sql/statements/create-external-file-format-transact-sql
You plan to create a real-time monitoring app that alerts users when a device travels more than 200 meters away from a designated location.
You need to design an Azure Stream Analytics job to process the data for the planned app. The solution must minimize the amount of code developed and the number of technologies used.
What should you include in the Stream Analytics job?
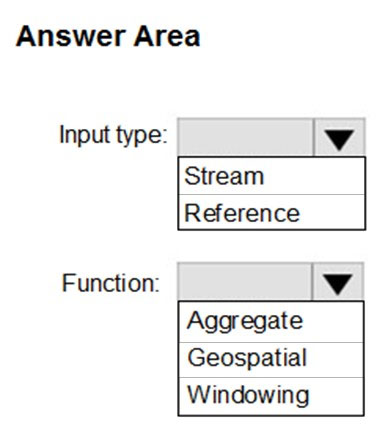
Input type: Stream
You can process real-time IoT data streams with Azure Stream Analytics.
Function: Geospatial
With built-in geospatial functions, you can use Azure Stream Analytics to build applications for scenarios such as fleet management, ride sharing, connected cars, and asset tracking.
Note: In a real-world scenario, you could have hundreds of these sensors generating events as a stream. Ideally, a gateway device would run code to push these events to Azure Event Hubs or Azure IoT Hubs.
Reference:
https://docs.microsoft.com/en-us/azure/stream-analytics/stream-analytics-get-started-with-azure-stream-analytics-to-process-data-from-iot-devices
https://docs.microsoft.com/en-us/azure/stream-analytics/geospatial-scenarios