DP-203: Data Engineering on Microsoft Azure
Question 91
You plan to create a dimension table in Azure Synapse Analytics that will be less than 1 GB.
You need to create the table to meet the following requirements:
- Provide the fastest query time.
- Minimize data movement during queries.
Which type of table should you use?
hash distributed
heap
replicated
round-robin
Answer is Replicated
Usually common dimension tables or tables that doesn't distribute evenly are good candidates for round-robin distributed table. Note: Dimension tables or other lookup tables in a schema can usually be stored as round-robin tables. Usually these tables connect to more than one fact tables and optimizing for one join may not be the best idea. Also usually dimension tables are smaller which can leave some distributions empty when hash distributed.
Round-robin by definition guarantees a uniform data distribution.
Reference:
https://blogs.msdn.microsoft.com/sqlcat/2015/08/11/choosing-hash-distributed-table-vs-round-robin-distributed-table-in-azure-sql-dw-service/
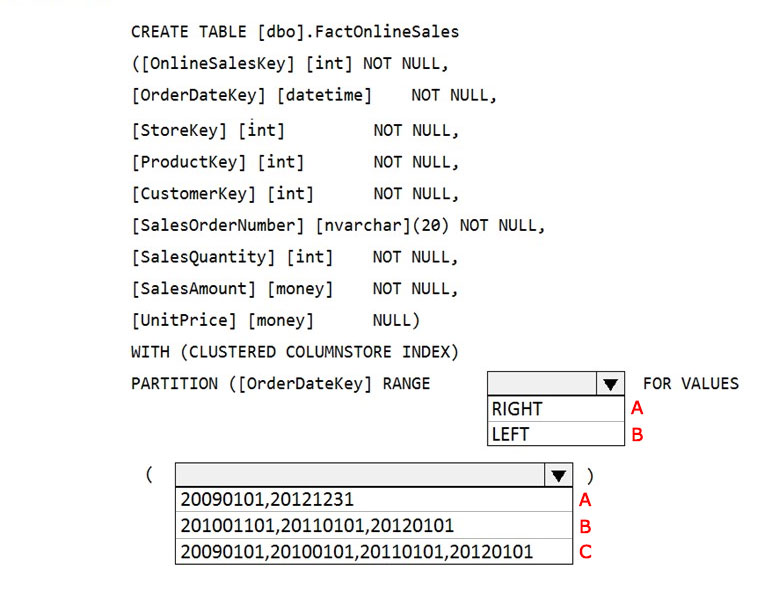
You have an enterprise data warehouse in Azure Synapse Analytics that contains a table named FactOnlineSales. The table contains data from the start of 2009 to the end of 2012.
You need to improve the performance of queries against FactOnlineSales by using table partitions. The solution must meet the following requirements:
- Create four partitions based on the order date.
- Ensure that each partition contains all the orders placed during a given calendar year.
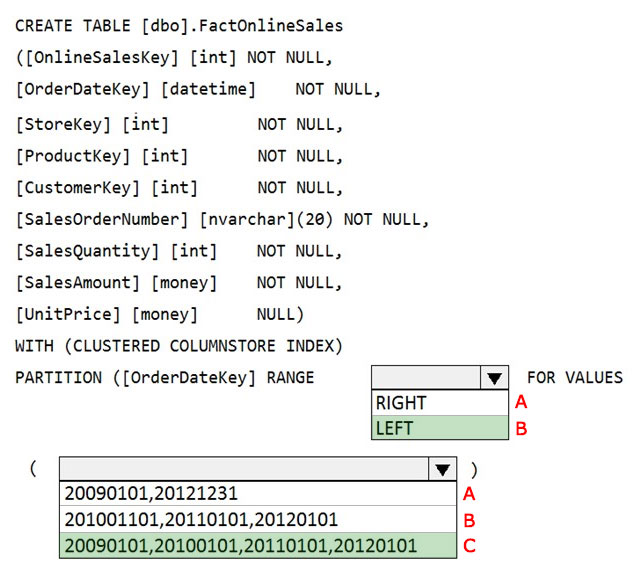
How should you complete the T-SQL command?

check

Box 1: LEFT
RANGE LEFT: Specifies the boundary value belongs to the partition on the left (lower values). The default is LEFT.
Box 2: 20090101, 20100101, 20110101, 20120101
FOR VALUES ( boundary_value [,...n] ) specifies the boundary values for the partition. boundary_value is a constant expression.
Reference:
https://docs.microsoft.com/en-us/sql/t-sql/statements/create-table-azure-sql-data-warehouse
You have a SQL pool in Azure Synapse that contains a table named dbo.Customers. The table contains a column name Email.
You need to prevent nonadministrative users from seeing the full email addresses in the Email column. The users must see values in a format of aXXX@XXXX.com instead.
What should you do?
From Microsoft SQL Server Management Studio, set an email mask on the Email column.
From the Azure portal, set a mask on the Email column.
From Microsoft SQL Server Management studio, grant the SELECT permission to the users for all the columns in the dbo.Customers table except Email.
From the Azure portal, set a sensitivity classification of Confidential for the Email column.
Answer is From the Azure portal, set a mask on the Email column.
Reference:
https://docs.microsoft.com/en-us/azure/azure-sql/database/dynamic-data-masking-overview
You are designing an enterprise data warehouse in Azure Synapse Analytics. You plan to load millions of rows of data into the data warehouse each day.
You must ensure that staging tables are optimized for data loading.
You need to design the staging tables.
What type of tables should you recommend?
Round-robin distributed table
Hash-distributed table
Replicated table
External table
Answer is Round-robin distributed table
You have a SQL pool in Azure Synapse.
A user reports that queries against the pool take longer than expected to complete.
You need to add monitoring to the underlying storage to help diagnose the issue.
Which two metrics should you monitor?
Cache used percentage
DWU Limit
Snapshot Storage Size
Active queries
Cache hit percentage
Answers are Cache used percentage and Cache hit percentage
Cache used percentage: Cache used is the sum of all bytes in the local SSD cache across all nodes and cache capacity is the sum of the storage capacity of the local SSD cache across all nodes.
Cache hit percentage: Cache hits is the sum of all columnstore segments hits in the local SSD cache and cache miss is the columnstore segments misses in the local SSD cache summed across all nodes.
Reference:
https://docs.microsoft.com/en-us/azure/synapse-analytics/sql-data-warehouse/sql-data-warehouse-concept-resource-utilization-query-activity
You have a SQL pool in Azure Synapse.
You discover that some queries fail or take a long time to complete.
You need to monitor for transactions that have rolled back.
Which dynamic management view should you query?
sys.dm_pdw_nodes_tran_database_transactions
sys.dm_pdw_waits
sys.dm_pdw_request_steps
sys.dm_pdw_exec_sessions
Answer is sys.dm_pdw_nodes_tran_database_transactions
You can use Dynamic Management Views (DMVs) to monitor your workload including investigating query execution in SQL pool.
If your queries are failing or taking a long time to proceed, you can check and monitor if you have any transactions rolling back.
Example:
-- Monitor rollback
SELECT
SUM(CASE WHEN t.database_transaction_next_undo_lsn IS NOT NULL THEN 1 ELSE 0 END), t.pdw_node_id, nod.[type]
FROM sys.dm_pdw_nodes_tran_database_transactions t
JOIN sys.dm_pdw_nodes nod ON t.pdw_node_id = nod.pdw_node_id
GROUP BY t.pdw_node_id, nod.[type]
Reference:
https://docs.microsoft.com/en-us/azure/synapse-analytics/sql-data-warehouse/sql-data-warehouse-manage-monitor#monitor-transaction-log-rollback
You are designing the folder structure for an Azure Data Lake Storage Gen2 container.
Users will query data by using a variety of services including Azure Databricks and Azure Synapse Analytics serverless SQL pools. The data will be secured by subject area. Most queries will include data from the current year or current month.
Which folder structure should you recommend to support fast queries and simplified folder security?
/{SubjectArea}/{DataSource}/{DD}/{MM}/{YYYY}/{FileData}_{YYYY}_{MM}_{DD}.csv
/{DD}/{MM}/{YYYY}/{SubjectArea}/{DataSource}/{FileData}_{YYYY}_{MM}_{DD}.csv
/{YYYY}/{MM}/{DD}/{SubjectArea}/{DataSource}/{FileData}_{YYYY}_{MM}_{DD}.csv
/{SubjectArea}/{DataSource}/{YYYY}/{MM}/{DD}/{FileData}_{YYYY}_{MM}_{DD}.csv
Answer is /{SubjectArea}/{DataSource}/{YYYY}/{MM}/{DD}/{FileData}_{YYYY}_{MM}_{DD}.csv
There's an important reason to put the date at the end of the directory structure. If you want to lock down certain regions or subject matters to users/groups, then you can easily do so with the POSIX permissions. Otherwise, if there was a need to restrict a certain security group to viewing just the UK data or certain planes, with the date structure in front a separate permission would be required for numerous directories under every hour directory. Additionally, having the date structure in front would exponentially increase the number of directories as time went on.
Note: In IoT workloads, there can be a great deal of data being landed in the data store that spans across numerous products, devices, organizations, and customers. It's important to pre-plan the directory layout for organization, security, and efficient processing of the data for down-stream consumers. A general template to consider might be the following layout:
{Region}/{SubjectMatter(s)}/{yyyy}/{mm}/{dd}/{hh}/
Reference:
https://docs.microsoft.com/en-us/azure/storage/blobs/data-lake-storage-best-practices#batch-jobs-structure
You need to design an Azure Synapse Analytics dedicated SQL pool that meets the following requirements:
- Can return an employee record from a given point in time.
- Maintains the latest employee information.
- Minimizes query complexity.
How should you model the employee data?
as a temporal table
as a SQL graph table
as a degenerate dimension table
as a Type 2 slowly changing dimension (SCD) table
Answer is as a Type 2 slowly changing dimension (SCD) table
A Type 2 SCD supports versioning of dimension members. Often the source system doesn't store versions, so the data warehouse load process detects and manages changes in a dimension table. In this case, the dimension table must use a surrogate key to provide a unique reference to a version of the dimension member. It also includes columns that define the date range validity of the version (for example, StartDate and EndDate) and possibly a flag column (for example, IsCurrent) to easily filter by current dimension members.
Reference:
https://docs.microsoft.com/en-us/learn/modules/populate-slowly-changing-dimensions-azure-synapse-analytics-pipelines/3-choose-between-dimension-types
You are building an Azure Analytics query that will receive input data from Azure IoT Hub and write the results to Azure Blob storage.
You need to calculate the difference in readings per sensor per hour.
How should you complete the query?

Box 1: LAG
The LAG analytic operator allows one to look up a previous event in an event stream, within certain constraints. It is very useful for computing the rate of growth of a variable, detecting when a variable crosses a threshold, or when a condition starts or stops being true.
Box 2: LIMIT DURATION
Example: Compute the rate of growth, per sensor:
SELECT sensorId,
growth = reading
LAG(reading) OVER (PARTITION BY sensorId LIMIT DURATION(hour, 1))
FROM input
Reference:
https://docs.microsoft.com/en-us/stream-analytics-query/lag-azure-stream-analytics
You have an Azure Synapse Analytics dedicated SQL pool.
You need to ensure that data in the pool is encrypted at rest. The solution must NOT require modifying applications that query the data.
What should you do?
Enable encryption at rest for the Azure Data Lake Storage Gen2 account.
Enable Transparent Data Encryption (TDE) for the pool.
Use a customer-managed key to enable double encryption for the Azure Synapse workspace.
Create an Azure key vault in the Azure subscription grant access to the pool.
Answer is Enable Transparent Data Encryption (TDE) for the pool.
Transparent Data Encryption (TDE) helps protect against the threat of malicious activity by encrypting and decrypting your data at rest. When you encrypt your database, associated backups and transaction log files are encrypted without requiring any changes to your applications. TDE encrypts the storage of an entire database by using a symmetric key called the database encryption key.
Reference:
https://docs.microsoft.com/en-us/azure/synapse-analytics/sql-data-warehouse/sql-data-warehouse-overview-manage-security