PL-300: Microsoft Power BI Data Analyst
What is the risk of having null values in a numeric column?
DAX expressions that MAX data will be incorrect
DAX expressions that SUM data will be incorrect
DAX expressions that AVERAGE data will be incorrect
Answer is DAX expressions that AVERAGE data will be incorrect
What functionality lets you see the code that is generated as part of each transformation step?
Advanced editor
Data profiling
Queries pane
Answer is Advanced editor
You have a prospective customer list that contains 1,500 rows of data. The list contains the following fields:
- First name
- Last name
- Email address
- State/Region
- Phone number
You import the list into Power Query Editor.
You need to ensure that the list contains records for each State/Region to which you want to target a marketing campaign.
Which two actions should you perform?
Open the Advanced Editor.
Select Column quality.
Enable Column profiling based on entire dataset.
Select Column distribution.
Select Column profile.
Answers are;
Enable Column profiling based on entire dataset.
Select Column profile.
The dataset have 1500 rows, if you don't enable the column profiling for the entire dataset, the column profiling will be only based on top 1000 rows. So first enable for entire dataset and after that run column profiling for the entire dataset.
References:
https://www.poweredsolutions.co/2019/08/13/data-profiling-quality-distribution-in-power-bi-power-query/
https://www.altentertraining.com/microsoft/power-bi/column-profiling-is-good/
You have a CSV file that contains user complaints. The file contains a column named Logged. Logged contains the date and time each complaint occurred. The data in Logged is in the following format: 2018-12-31 at 08:59.
You need to be able to analyze the complaints by the logged date and use a built-in date hierarchy.
What should you do?
Change the data type of the Logged column to Date.
Apply the Parse function from the Date transformations options to the Logged column.
Create a column by example that starts with 2018-12-31 and set the data type of the new column to Date.
Apply a transform to extract the first 11 characters of the Logged column.
Answer is Create a column by example that starts with 2018-12-31 and set the data type of the new column to Date.
To use a built-in-date hierarchy, you need to set the data type of the new column to Date.
Incorrect Answers:
D: To use a transform, you would have to select the Split option, not the Extract option.
References:
https://docs.microsoft.com/en-us/power-bi/create-reports/desktop-add-column-from-example
https://www.exceljetconsult.com.ng/home/blog/power-query-split-date-and-time-into-separate-columns/
You create the following step by using Power Query Editor.
- Table.ReplaceValue(SalesLT_Address,"1318","1319",Replacer.ReplaceText,{"AddressLine1"})
A row has a value of 21318 Lasalle Street in the AddressLine1 column.
What will the value be when the step is applied?
1318
1319
21318 Lasalle Street
21319 Lasalle Street
Answer is 21319 Lasalle Street
Reference:
https://docs.microsoft.com/en-us/powerquery-m/table-replacevalue
You have a Microsoft SharePoint Online site that contain several document libraries.
One of the document libraries contains manufacturing reports saved as Microsoft Excel files. All the manufacturing reports have the same data structure.
You need to use Power BI Desktop to load only the manufacturing reports to a table for analysis.
What should you do?
Get data from a SharePoint Online folder, enter the site URL, and then select Combine & Load.
Get data from a SharePoint Online list and enter the site URL. Select Combine & Transform, then filter by the folder path to the manufacturing reports library.
Get data from a SharePoint Online folder and enter the site URL. Select Combine & Transform, then filter by the folder path to the manufacturing reports library.
Get data from a SharePoint Online list, enter the site URL, and then select Combine & Load.
Answer is Get data from a SharePoint Online folder and enter the site URL. Select Combine & Transform, then filter by the folder path to the manufacturing reports library.
Reference:
https://www.c-sharpcorner.com/article/combine-and-transform-data-of-multiple-files-located-in-a-folder-in-power-bi/
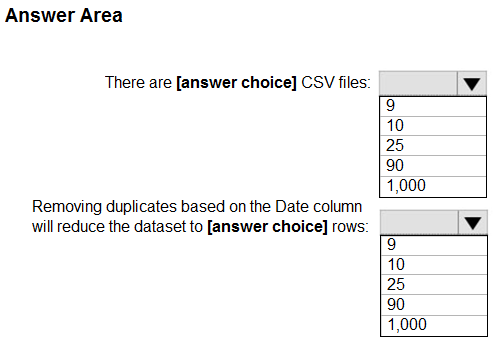
You view a query named Transactions as shown in the following exhibit.

The query gets CSV files from a folder.
Use the drop-down menus to select the answer choice that completes each statement based on the information presented in the graphic.

Box 1: 9
9 distinct CSV files.
Box 2: 10
10 distinct dates.
Which data profiling tools does Power Query have?
Column from examples, custom column, and conditional column
Column quality, distribution, and profile
Index column and duplicate column
Format, extract, and parse
Answer is Column quality, distribution, and profile
The VIEW tab includes data profiling tools like column quality, distribution, and profile
Which data profiling tool can you use to check the number of errors in a column?
Column quality
Column distribution
Column profile
Column quality & column profile
Answer is Column quality & column profile
Column quality shows the percentage of values within a column that are valid, have errors, or are empty; column profile provides this information in the column statistics as well.
What is the purpose of data profiling in Power Query?
Provide a visual way to explore data
Get a sense of your dataset composition
To solve column quality issues
All of the above
Answer is All of the above
Data profiling tools like column quality, column distribution, and column profile provide a visual way to explore data and get a sense of your dataset composition, while the contextual menus allow you to solve column quality issues.