PL-300: Microsoft Power BI Data Analyst
Can a dashboard be created from multiple reports?
No, dashboards can only be created from a single dataset or report.
Yes, dashboards can be created from multiple datasets or reports.
Answer is Yes, dashboards can be created from multiple datasets or reports.
Where can you configure and set alerts?
Data alerts can be set only in Power BI service on specific visuals such as KPI cards, gauges, and cards.
Data alerts can be set in both Power BI service and Power BI Desktop on any kind of visual.
Data alerts can be set in Power BI service on any kind of visual.
Data alerts can be set only in Power BI Desktop on specific kinds of visuals such as KPI cards and gauges.
Answer is Data alerts can be set only in Power BI service on specific visuals such as KPI cards, gauges, and cards.
What is a key benefit of Power BI’s real-time streaming capabilities?
Users are limited to the data refresh as established by the developer.
You can stream data and update dashboards as soon as the data is logged.
Answer is You can stream data and update dashboards as soon as the data is logged.
Pinning an entire report page to a dashboard ensure what?
Users are seeing individual tiles displaying key results.
Pinning a page is an easy way to pin more than one visualization at a time. Also, when you pin an entire page, the tiles are live; you can interact with them right there on the dashboard.
Answer is Pinning a page is an easy way to pin more than one visualization at a time. Also, when you pin an entire page, the tiles are live; you can interact with them right there on the dashboard.
What feature allows you to ask a natural-language query about the data?
The synonym feature
The smart narrative visual
The Q&A feature
Answer is The Q&A feature
What feature in dashboards is used to alert consumers to the sensitivity of the data?
Dashboard themes
Data classification
Answer is Data classification
You have a Power BI dashboard that monitors the quality of manufacturing processes. The dashboard contains the following elements:
A line chart that shows the number of defective products manufactured by day.
- A KPI visual that shows the current daily percentage of defective products manufactured.
You need to be notified when the daily percentage of defective products manufactured exceeds 3%.
What should you create?
a Q&A visual
a subscription
a smart narrative visual
an alert
Answer is an alert
Reference: https://docs.microsoft.com/en-us/power-bi/consumer/end-user-alerts
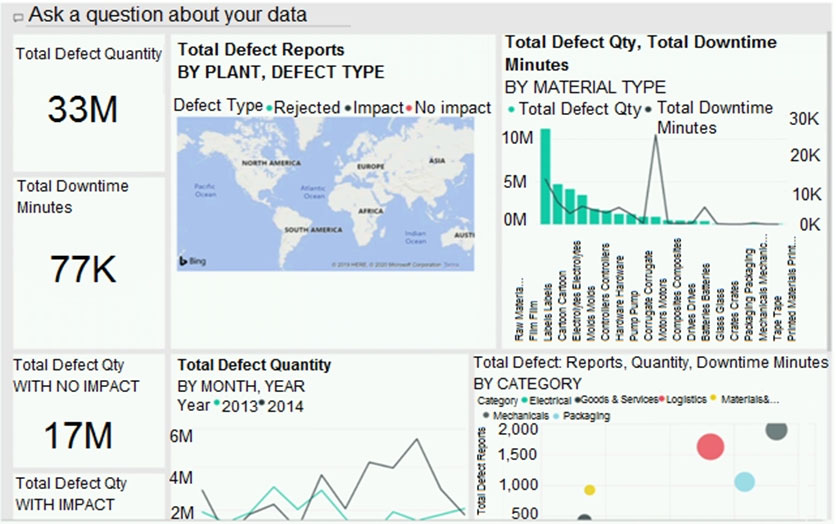
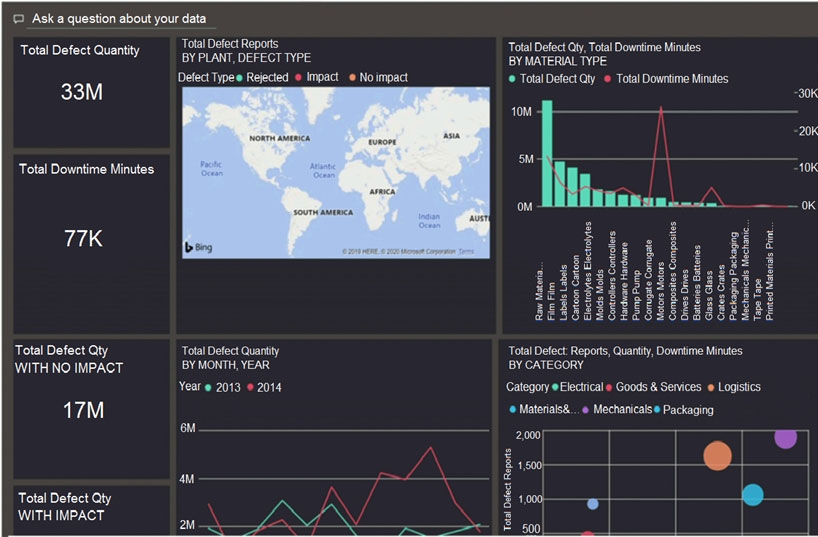
You have a dashboard that contains tiles pinned from a single report as shown in the Original Dashboard exhibit.

You need to modify the dashboard to appear as shown in the Modified Dashboard exhibit.

What should you do?
Edit the details of each tile.
Change the report theme.
Change the dashboard theme.
Create a custom CSS file.
Answer is Change the dashboard theme.
Reference:
https://docs.microsoft.com/en-us/power-bi/create-reports/service-dashboard-themes
Which of the following is not an option when editing report interactions?
Filter
Highlight
None
Drill through
Answer is Drill through
Report interactions allow you to define how filters applied to one visual impact the others. The options are: filter, which produces a fully filtered chart; highlight, which produced a chart that highlights the filtered segments; and none, in which the chart remains unfiltered. Drill through is a separate type of filter.

What type of visual interaction has been applied to the bar chart above?
Filter
Highlight
Subfilter
None of the above
Answer is Highlight
When the interaction mode is set to “highlight”, the relevant subsegments in the chart are highlighted based on the selection .