PL-300: Microsoft Power BI Data Analyst
Which of the following functions allows you to define filtered views for a specific list of users?
USER
USERPRINCIPALNAME
ROLE
USERELATIONSHIP
Answer is USERPRINCIPALNAME
Dynamic roles allow you to define filtered views for a specific list of users with the DAX functions USERNAME or USERPRINCIPALNAME.
RLS rules can be applied to users with which permission level?
Admin
Member
Contributor
Viewer
Answer is Viewer
Once RLS rules have been defined in Power BI Desktop, they can be applied to users who you’ve shared reports with or have Viewer permissions in Power BI Service.
You plan to create a Power BI report. You have the schema model shown in the exhibit.

The model has the following relationships:
- Store to District based on DistrictID
- Sales to Store based on LocationID
- Sales to Date based on PeriodID
- Sales to Item based on ItemID
You configure row-level security (RLS) so that the district managers of the stores only see the sales from the stores they manage.
When the district managers view the Store by Items report, they see items for all the stores.
You need to ensure that the district managers can see items for the stores they manage only.
How should you configure the relationship from Sales to Item?
Select Assume Referential Integrity.
Change the Cardinality to One to Many (1:*).
Change the Cross filter direction to Both.
Change the Cardinality to One to one (1:1).
Answer is Change the Cross filter direction to Both.
Row-level security filtering uses single-directional filters, regardless of whether the relationships are set to single direction or bi-directional. You can manually enable bi-directional cross-filter with row-level security by selecting the relationship and checking the Apply security filter in both directions checkbox.
Reference:
https://docs.microsoft.com/en-us/power-bi/service-admin-rls
You have a Power BI semantic model named Model1 that contains four tables named Sales, Date, Product, and Employee. The Sales table is related to the Date, Product, and Employee tables.
You need to create a row-level security (RLS) role that meets the following requirements:
• Employees must be able to view their respective sales only.
• The RLS filter must match the user to their email address.
Which table filter expression should you use for the RLS role?
Employee[EmailAddress] = USERCULTURE()Employee[EmailAddress] = USERNAME()Employee[EmailAddress] = USEROBJECTID()Employee[EmailAddress] = USERPRINCIPALNAME()Answer is
Employee[EmailAddress] = USERPRINCIPALNAME()
You have Power BI workspace named WS1.
You publish a semantic model named Model1 to WS1. Model1 contains a row-level security (RLS) role named RLS1.
You plan to use a group to add members to RLS1.
What should you use?
an Active Directory Domain Services security group
a distribution list
a Microsoft 365 group
a Microsoft Entra security group
Answer is a Microsoft Entra security group
Power BI only supports Microsoft Entra security groups (formerly Azure AD security groups) for Row-Level Security (RLS). You cannot use distribution lists or Microsoft 365 groups for RLS assignments.
Active Directory Domain Services (AD DS) security groups (Option A) are for on-premises environments and are not supported in Power BI Service.
Distribution lists (Option B) are only for email purposes and do not work for RLS.
Microsoft 365 groups (Option C) are mainly used for collaboration (Teams, SharePoint, etc.), but they cannot be used for RLS assignments.
Microsoft Entra security groups (Option D) are explicitly supported for managing access control in Power BI, making them the correct choice.
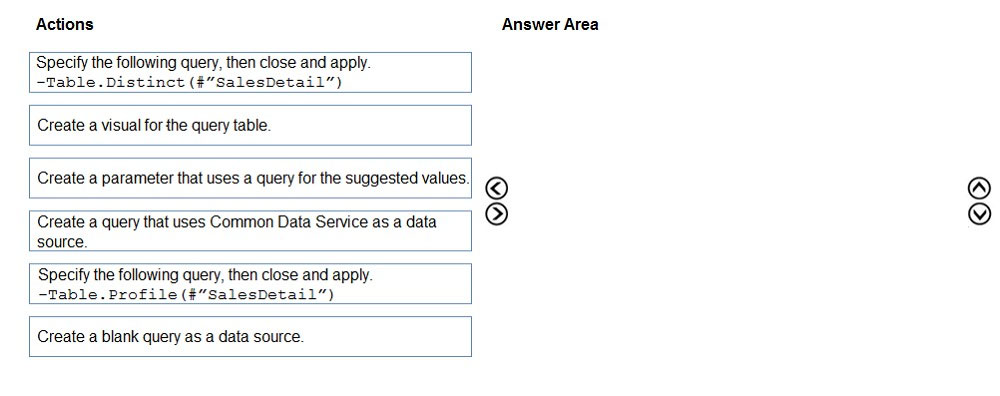
You are modeling data in a table named SalesDetail by using Microsoft Power BI. You need to provide end users with access to the summary statistics about the SalesDetail data. The users require insights on the completeness of the data and the value distributions. Which three actions should you perform in sequence?

You are modeling data by using Microsoft Power BI. Part of the data model is a large Microsoft SQL Server table named Order that has more than 100 million records. During the development process, you need to import a sample of the data from the Order table. Solution: You add a report-level filter that filters based on the order date. Does this meet the goal?
Yes
No
Answer is No
The filter is applied after the data is imported. Instead add a WHERE clause to the SQL statement.
Reference:
https://docs.microsoft.com/en-us/power-bi/connect-data/service-gateway-sql-tutorial
You are modeling data in a table named SalesDetail by using Microsoft Power BI.
You need to provide end users with access to the summary statistics about the SalesDetail data. The users require insights on the completeness of the data and the value distributions.
Which three actions should you perform in sequence?
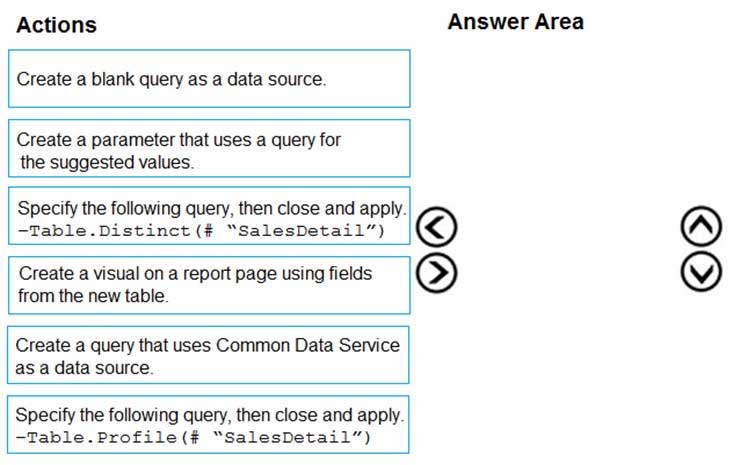
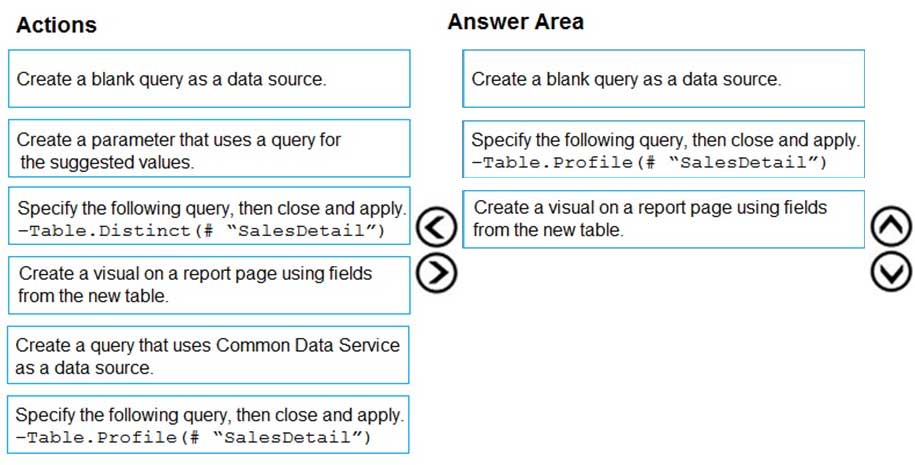
Step 1: Create a blank query as a data source
Start with a New Source in Power Query Editor, and then Blank Query.
Create a parameter that use a query for suggested values.
Step 2: Specify the following query, then close and apply. -Table.Profile(#_"SalesDetail")
In the new blank query, in the formula bar (if you don't see the formula bar, check the formula bar option in the View tab of the Power Query Editor), type below expression:
=Table.Profile()
Note that this code is not complete yet, we need to provide a table as the input of this function.
Note: The Table.Profile() function takes a value of type table and returns a table that displays, for each column in the original table, the minimum, maximum, average, standard deviation, count of values, count of null values and count of distinct values.
Step 3: Create a visual for the query table.
The profiling data that you get from Table.
After loading the data into Power BI, you'll have the table with all columns, and it can be used in any visuals.
Reference:
https://radacad.com/create-a-profiling-report-in-power-bi-give-the-end-user-information-about-the-data
You are preparing a financial report in Power BI.
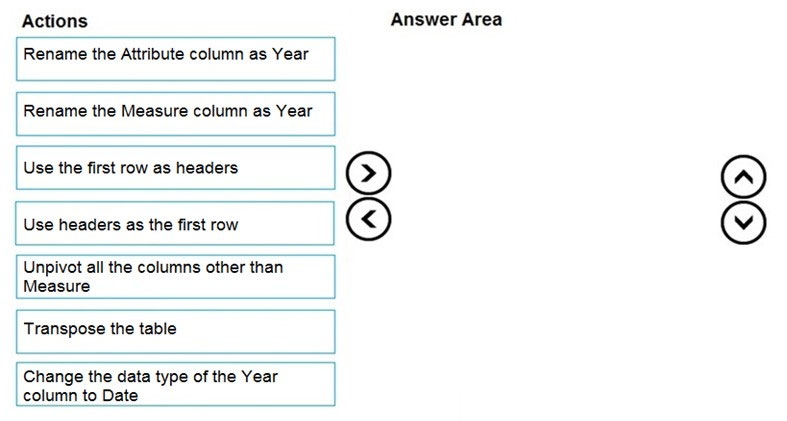
You connect to the data stored in a Microsoft Excel spreadsheet by using Power Query Editor as shown in the following exhibit.

You need to prepare the data to support the following:
- Visualizations that include all measures in the data over time
- Year-over-year calculations for all the measures
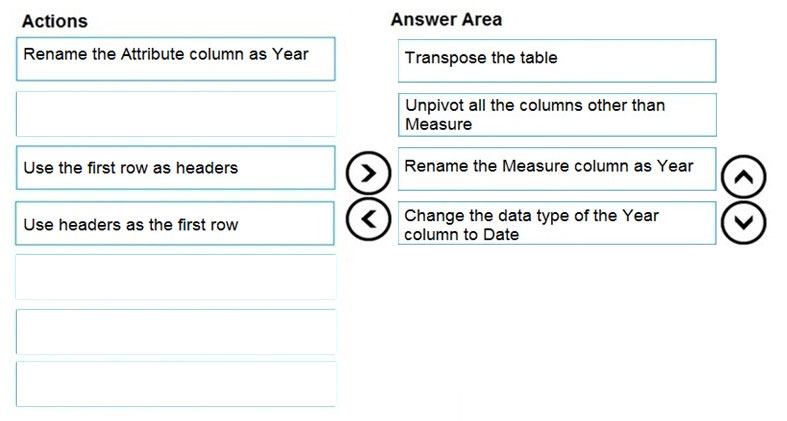
Which four actions should you perform in sequence?
Question 300
You have a Microsoft Power BI data model that contains three tables named Sales, Product, and Date.
The Sales table has an existing measure named [Total Sales] that sums the total sales from the Sales table.
You need to write a calculation that returns the percentage of total sales that a selected ProductCategoryName value represents. The calculation must respect any slicers on ProductCategoryName and must show the percentage of visible total sales. For example, if there are four ProductCategoryName values, and a user filters one out, a table showing ProductCategoryName and the calculation must sum up to 100 percent.
How should you complete the calculation?

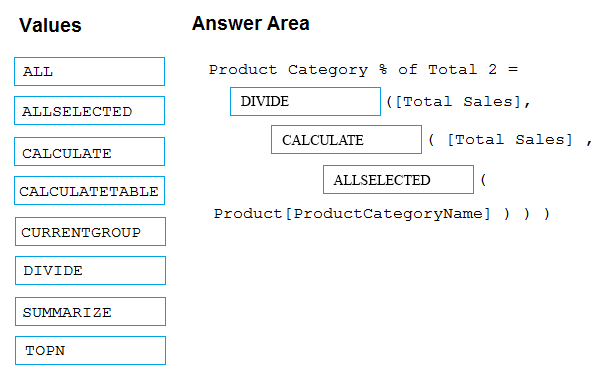
Box 1: DIVIDE
As a data modeler, when you write a DAX expression to divide a numerator by a denominator, you can choose to use the DIVIDE function or the divide operator (/- forward slash).
When using the DIVIDE function, you must pass in numerator and denominator expressions.
Box 2: CALCULATE
CALCULATE rvaluates an expression in a modified filter context.
Box 3: ALLSELECTED
ALLSELECTED removes context filters from columns and rows in the current query, while retaining all other context filters or explicit filters. The ALLSELECTED function gets the context that represents all rows and columns in the query, while keeping explicit filters and contexts other than row and column filters. This function can be used to obtain visual totals in queries.
Example:
measure 'Reseller Sales'[Reseller Visual Total]=calculate(sum('Reseller Sales'[Sales Amount]), ALLSELECTED())
Reference:
https://docs.microsoft.com/en-us/dax/allselected-function-dax
