PL-300: Microsoft Power BI Data Analyst
You are configuring a Microsoft Power BI data model to enable users to ask natural language questions by using Q&A.
You have a table named Customer that has the following measure.
Customer Count = DISTINCTCOUNT(Customer[CustomerID])Users frequently refer to customers as subscribers.
You need to ensure that the users can get a useful result for "subscriber count" by using Q&A. The solution must minimize the size of the model.
What should you do?
Set Summarize By to None for the CustomerID column.
Add a synonym of "subscriber" to the Customer table.
Add a synonym of "subscriberID" to the CustomerID column.
Add a description of "subscriber count" to the Customer Count measure.
Answer is Add a synonym of "subscriber" to the Customer table.
You can add synonyms to tables and columns.
Note: This step applies specifically to Q&A (and not to Power BI reports in general). Users often have a variety of terms they use to refer to the same thing, such as total sales, net sales, total net sales. You can add these synonyms to tables and columns in the Power BI model.
This step applies specifically to Q&A (and not to Power BI reports in general). Users often have a variety of terms they use to refer to the same thing, such as total sales, net sales, total net sales. You can add these synonyms to tables and columns in the Power BI model.
Reference:
https://docs.microsoft.com/en-us/power-bi/natural-language/q-and-a-best-practices
Which of the following is not a best practice when using the Q&A visual?
Fix incorrect data types
Add axis labels to all the charts
Add missing relationships between tables
Add synonyms to tables and columns
Answer is Add axis labels to all the charts
Best practices are: Use new Q&A tooling to interact with queries and make improvements; add missing relationships between tables; rename tables and columns; fix incorrect data types; normalize your model (single table or column per question); add synonyms to tables and columns.
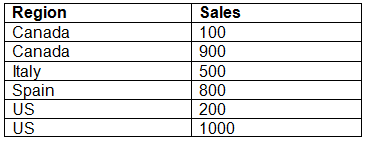
From the Home tab in Power BI Desktop, you click Enter Data and create a table named Sales that contains the following data.

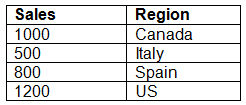
You add Region and Sales to visualization and the visualization displays the following data.

What causes the visualization to display four rows of data instead of six?
the Data Category of Region
the Default Summarization on Region
the Default Summarization on Sales
the Data Category of Sales
Answer is the Default Summarization on Sales
By default the column aggregation for Sales will be SUM. If there is summarization set on Region then the visualization will show count of regions and not in an unsummarized fashion like the source data.
You need to create a custom visualization for Power BI.
What should you install first?
jQuery
Node.js
Microsoft Azure PowerShell
Microsoft.NET
Answer is Node.js
To develop custom visuals, you need to have NodeJS installed with Power BI tools and a server certificate.
Reference:
https://docs.microsoft.com/en-us/power-bi/service-custom-visuals-getting-started-with-developer-tools
https://docs.microsoft.com/en-us/power-bi/developer/visuals/custom-visual-develop-tutorial
You create a Power BI model that contains the sales for the last five years. The size of the model is 950 MB. The Sales table contains five million rows.
You need to minimize the model size and perform the following analysis:
Current and one previous year sales for all active products
Current year sales by product category
What should you do?
Remove the Product Status column.
Remove the rows that relate to inactive products.
Remove the rows that relate to sales that occurred more than two years earlier.
Remove the Sale Date column.
Answer is Remove the rows that relate to sales that occurred more than two years earlier.
What is the benefit of using a report tooltip?
To give users the ability to export data from the visual.
To provide additional detail that is specific to the context of the data that is being hovered over.
To give users additional information about a report visual, such as the author and date/time it was created.
Answer is To provide additional detail that is specific to the context of the data that is being hovered over.
Do you need to import custom visuals each time you want to use them when you are developing a new report?
Yes, custom visuals must be imported from AppSource each time you start developing a new report.
No, custom visuals are always available for selection under the Visualization pane.
No, custom visuals only need to be imported once and will always remain in Power BI for future use in a new report.
Answer is Yes, custom visuals must be imported from AppSource each time you start developing a new report.
Which of the following filters are not available in Power BI reports?
Drillthrough
Report level
Page type
Page level
Answer is Page type
How can you analyze performance of each of your report elements?
By using performance analyzer.
By analyzing your metadata.
By deleting unnecessary rows and columns to reduce your dataset size.
Answer is By using performance analyzer.
Can you use bookmarks to create a slide show in Power BI?
No, you cannot, because bookmarks are not dynamic.
Yes, you can, by adding buttons as navigation to go between saved bookmarks.
No, you will require a specific visual to achieve this task.
Answer is Yes, you can, by adding buttons as navigation to go between saved bookmarks.