PL-300: Microsoft Power BI Data Analyst
You have several reports and dashboards in a workspace.
You need to grant all organizational users read access to a dashboard and several reports.
Solution: You create an Azure Active Directory group that contains all the users. You share each report and dashboard to the group.
Does this meet the goal?
Yes
No
Answer is No
Instead assign all the users the Viewer role to the workspace.
Note: The Viewer role gives a read-only experience to its users. They can view dashboards, reports, or workbooks in the workspace, but can't browse the datasets or dataflows. Use the Viewer role wherever you would previously use a classic workspace set to Members can only view Power BI content.
Reference:
https://powerbi.microsoft.com/en-us/blog/announcing-the-new-viewer-role-for-power-bi-workspaces/
You have several reports and dashboards in a workspace.
You need to grant all organizational users read access to a dashboard and several reports.
Solution: You assign all the users the Viewer role to the workspace.
Does this meet the goal?
Yes
No
Answer is Yes
The Viewer role gives a read-only experience to its users. They can view dashboards, reports, or workbooks in the workspace, but can't browse the datasets or dataflows. Use the Viewer role wherever you would previously use a classic workspace set to Members can only view Power BI content.
Reference:
https://powerbi.microsoft.com/en-us/blog/announcing-the-new-viewer-role-for-power-bi-workspaces/
You have several reports and dashboards in a workspace.
You need to grant all organizational users read access to a dashboard and several reports.
Solution: You enable included in app for all assets.
Does this meet the goal?
Yes
No
Answer is No
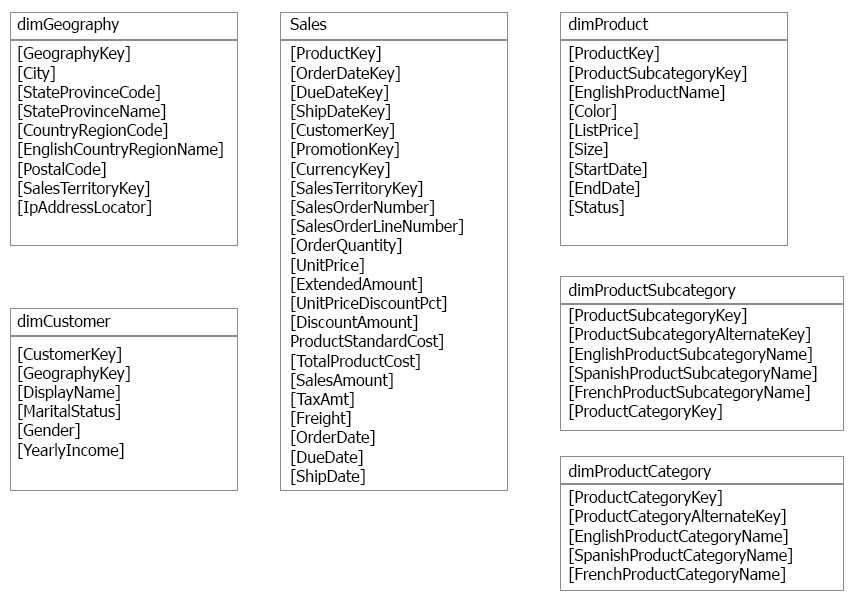
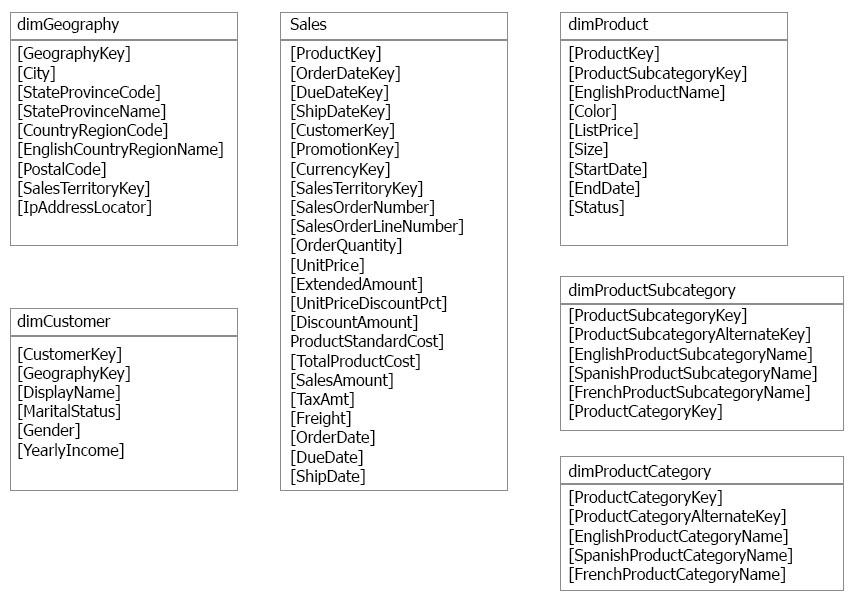
You have a Microsoft SQL Server database that has the tables shown in the Database Diagram exhibit.
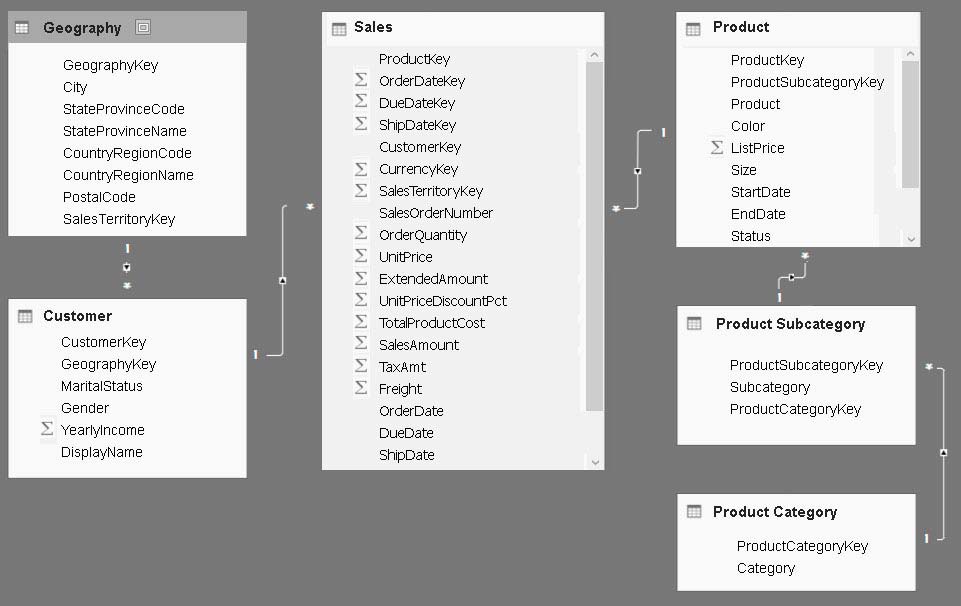
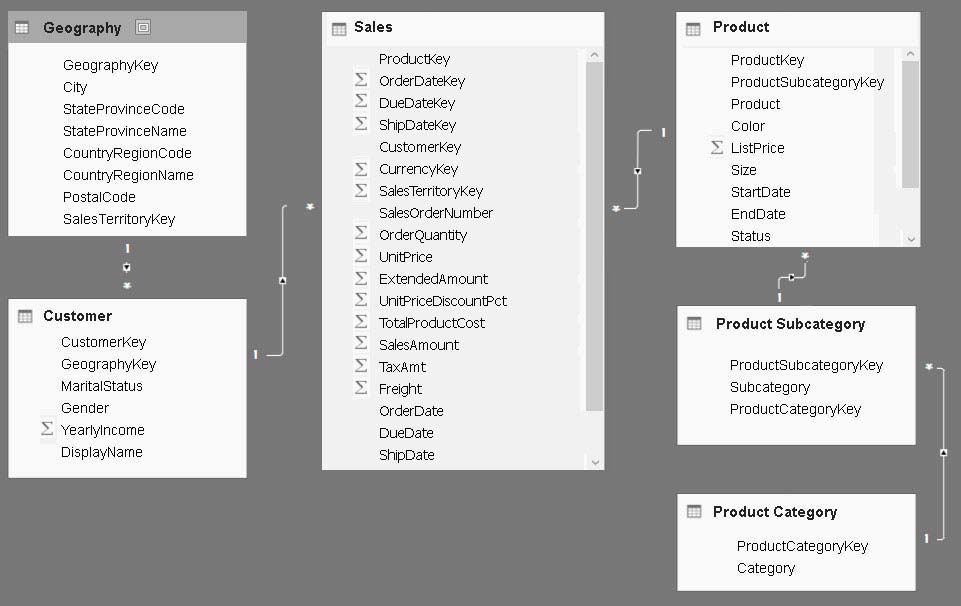
You plan to develop a Power BI model as shown in the Power BI Model exhibit.
You plan to use Power BI to import data from 2013 to 2015.
Product Subcategory[Subcategory] contains NULL values.
End of Repeated Scenario.
You implement the Power BI model.
You need to add a new column to the Product Subcategory table that uses the following formula.
=if [Subcategory]=null then "NA" else [Subcategory]Which command should you use in Query Editor?
Conditional Column
Column From Examples
Invoke Custom Function
Custom Column
Answer is Custom Column
If you want to add a formula, then add a custom column. A conditional column is just a custom column with a form that creates the formula for you.
References:
http://community.powerbi.com/t5/Desktop/if-then-else/td-p/117999
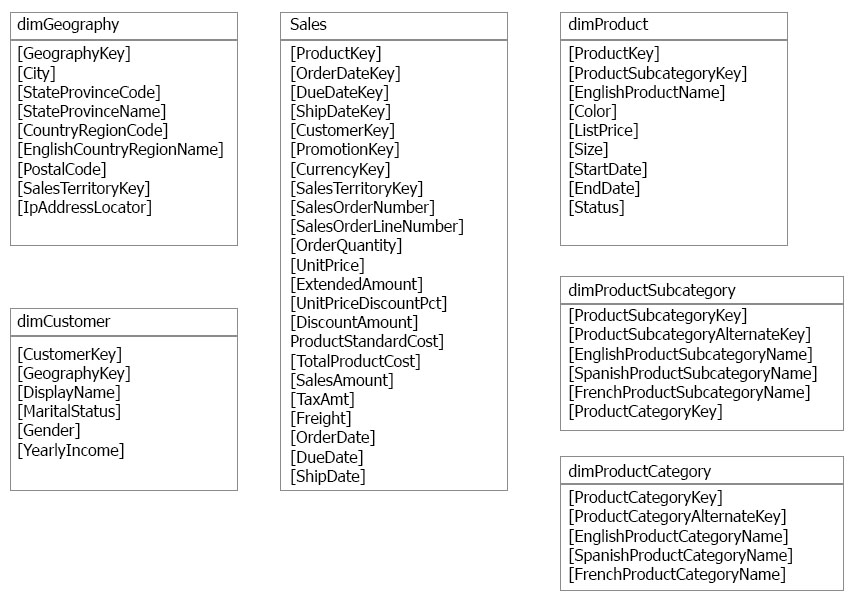
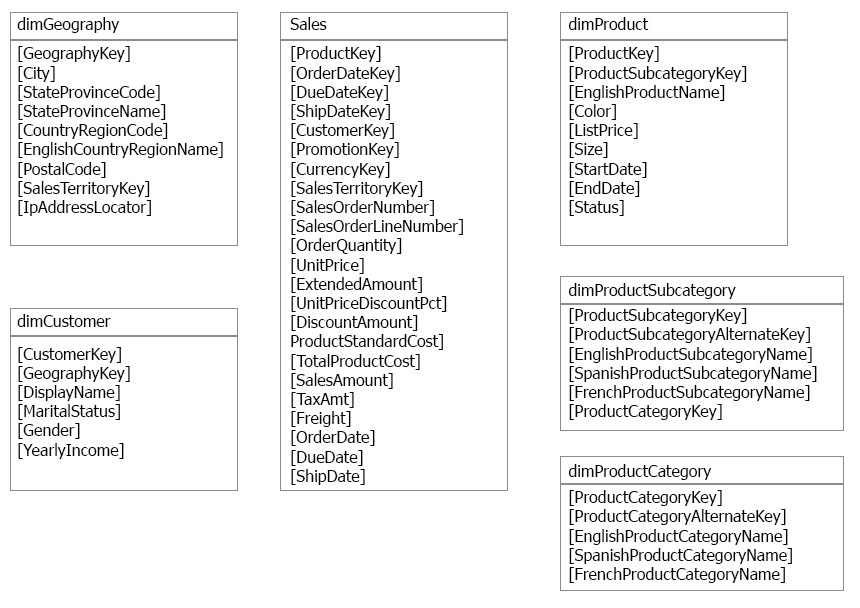
You have a Microsoft SQL Server database that has the tables shown in the Database Diagram exhibit.
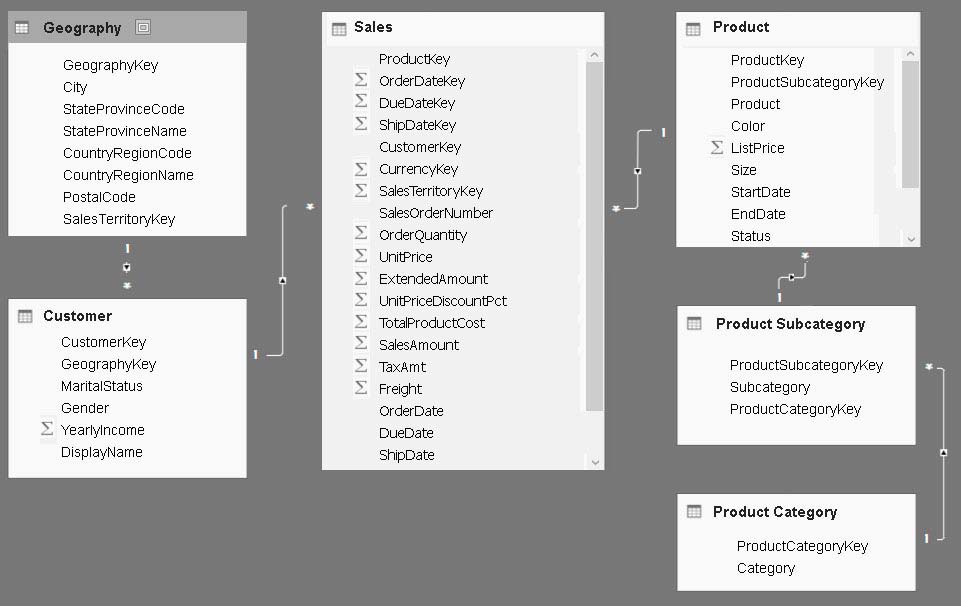
You plan to develop a Power BI model as shown in the Power BI Model exhibit.
You plan to use Power BI to import data from 2013 to 2015.
Product Subcategory[Subcategory] contains NULL values.
End of Repeated Scenario.
You are implementing the Power BI model.
You need to edit the Product Category query to match the desired Power BI model.
How should you complete the advanced query? To answer, drag the appropriate values to the correct targets. Each value may be used once, more than once, or not at all. You may need to drag the split bar between panes or scroll to view content.

Answer is Table.Remove Columns and Table.RenameColumns
References:
https://msdn.microsoft.com/en-us/library/mt260776.aspx
https://msdn.microsoft.com/en-us/library/mt260808.aspx
You have a Microsoft SQL Server database that has the tables shown in the Database Diagram exhibit.
You plan to develop a Power BI model as shown in the Power BI Model exhibit.
You plan to use Power BI to import data from 2013 to 2015.
Product Subcategory[Subcategory] contains NULL values.
End of Repeated Scenario.
You implement the Power BI model.
You need to create a hierarchy that has Category, Subcategory, and Product.
Which three actions should you perform in sequence?

Answer is 5-2-4
There's no direct relationship between Product and Product Category? That's why the subcategory goes first
You have a Microsoft SQL Server database that has the tables shown in the Database Diagram exhibit. (Click the Exhibit button.)
 You plan to develop a Power BI model as shown in the Power BI Model exhibit.
You plan to use Power BI to import data from 2013 to 2015.
Product Subcategory[Subcategory] contains NULL values.
End of Repeated Scenario.
You implement the Power BI model.
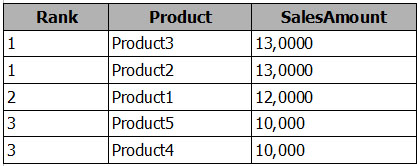
You need to add a measure to rank total sales by product. The results must appear as shown in the following table.
Which DAX formula should you use?
Product Ranking = RANKX(ALL('Product'), [SalesAmount],,Asc, Dense)
Product Ranking = RANKX(ALL('Product'), [SalesAmount],,DESC, Skip)
Product Ranking = RANKX(ALL('Product'), [SalesAmount],,DESC, Dense)
Product Ranking = RANKX(Product, [SalesAmount],,DESC, Skip)
Answer is Product Ranking = RANKX(ALL('Product'), [SalesAmount],,DESC, Dense)
Dense - The next rank value, after a tie, is the next rank value. For example if five (5) values are tied with a rank of 11 then the next value will receive a rank of 12.
Reference:
https://docs.microsoft.com/en-us/dax/rankx-function-dax
You have a Microsoft SQL Server database that has the tables shown in the Database Diagram exhibit.
You plan to develop a Power BI model as shown in the Power BI Model exhibit.
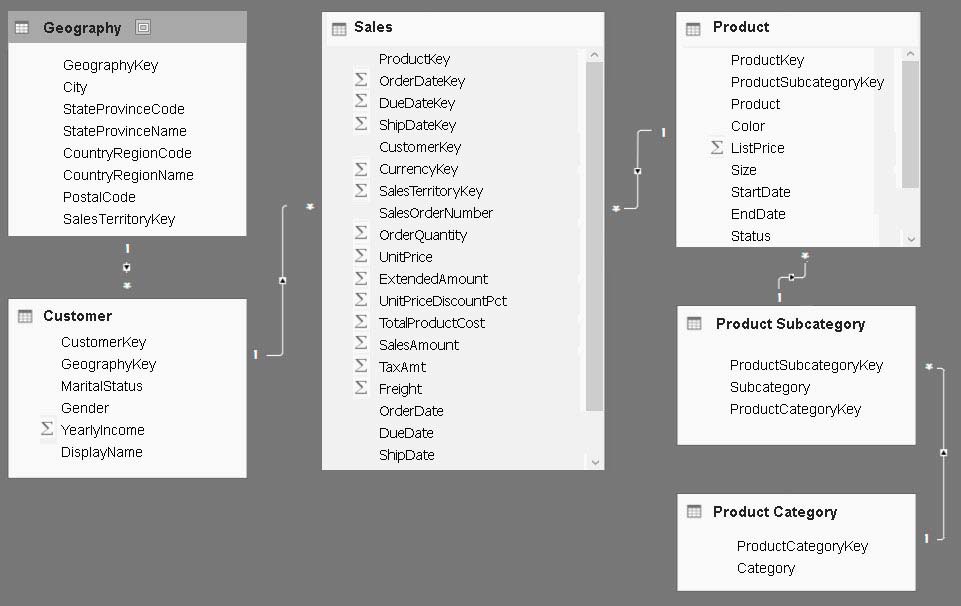
You plan to use Power BI to import data from 2013 to 2015.
Product Subcategory[Subcategory] contains NULL values.
End of Repeated Scenario.
You need to create a measure of Sales[SalesAmount] where Product[Color] is Red or Product[Size] is 50.
Which DAX formula should you use?
A.

B.

C.
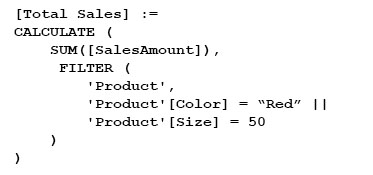
D.
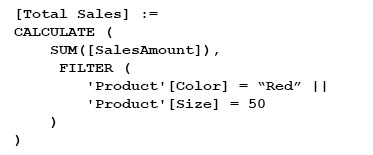
Answer is C
You can write a filter over two columns using a filter over the entire table that contains both columns.
[Sales Red or Contoso - table filter] :=
CALCULATE (
[Sales Amount],
FILTER (
'Product',
'Product'[Color] = "Red" || 'Product'[Brand] = "Contoso"
)
)
Or the other Nested DAX like
= SUMX(Filter(table, filter-1, filter2), [Sales Amount]))Example: = SUMX(FILTER(InternetSales, InternetSales[SalesTerritoryID]=5),[Freight])Reference:
https://www.sqlbi.com/articles/filter-arguments-in-calculate/
You have a Microsoft SQL Server database that has the tables shown in the Database Diagram exhibit.
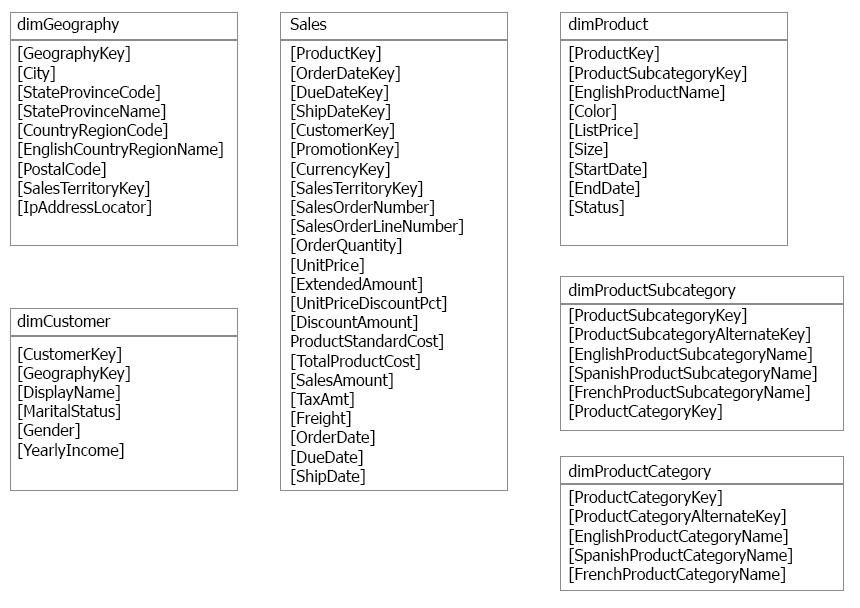
You plan to develop a Power BI model as shown in the Power BI Model exhibit.

You plan to use Power BI to import data from 2013 to 2015.
Product Subcategory[Subcategory] contains NULL values.
End of Repeated Scenario.
You implement the Power BI model.
You add another table named Territory to the model. A sample of the data is shown in the following table.
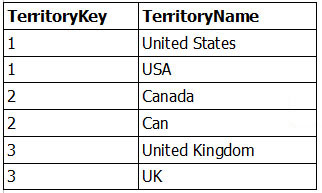
You need to create a relationship between the Territory table and the Sales table.
Which function should you use in the query for Territory before you create the relationship?
Table.Distinct
Table.IsDistinct
Table.ReplaceMatchingRows
Table.RemoveMatchingRows
Answer is Table.Distinct
You need to supply TerritoryKey as the 2nd argument to the Table.Distinct
#"Removed Duplicates" = Table.Distinct(#"Previous Step", {"TerritoryKey"})
Table.RemoveMatchingRows will remove the rows matching a particular value, but will not remove duplicates.
Reference:
https://docs.microsoft.com/en-us/powerquery-m/table-removematchingrows
You have a Microsoft SQL Server database that has the tables shown in the Database Diagram exhibit.
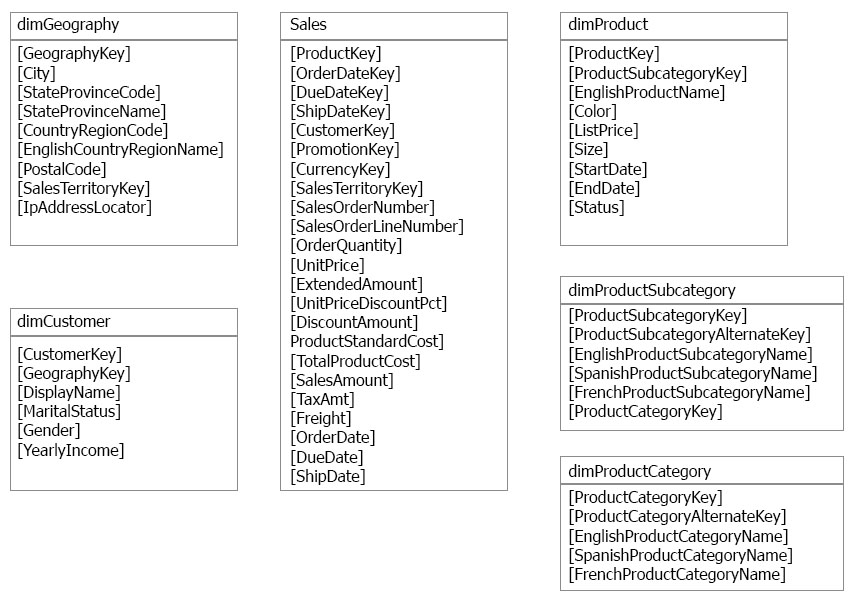
You plan to develop a Power BI model as shown in the Power BI Model exhibit.
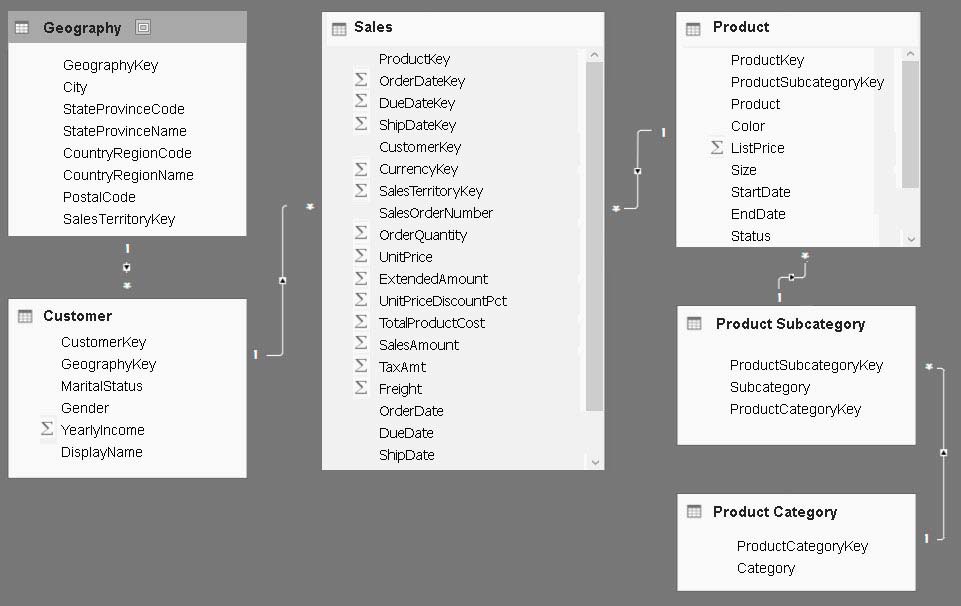
You plan to use Power BI to import data from 2013 to 2015.
Product Subcategory[Subcategory] contains NULL values.
End of Repeated Scenario.
You implement the Power BI model.
You plan to add a table named Date to the model. The table will have columns for the date, year, month, and end of the last month, and will include data from January 1, 2013 to December 31, 2015.
The Date table and the Sales table will have a relationship.
Which DAX functions should you use to create the columns?
CALENDARAUTO, YEAR, MONTH, and EOMONTH
CALENDAR, YEAR, MONTH, and ENDOFMONTH
CALENDARAUTO, YEAR, MONTH, and ENDOFMONTH
CALENDAR, YEAR, MONTH, and EOMONTH
Answer is CALENDAR, YEAR, MONTH, and EOMONTH
1. CALENDAR instead of CALENDARAUTO is because we need to specify Jan 1 to Dec 31 frm 2013 to 2015.
What if auto may give u Jan something else.
2. EOMONTH instead of EndOfMonth is because we EOM returns a date, EndofM return a table.
References:
https://docs.microsoft.com/en-us/dax/calendar-function-dax
https://docs.microsoft.com/en-us/dax/calendarauto-function-dax
https://docs.microsoft.com/en-us/dax/eomonth-function-dax
https://docs.microsoft.com/en-us/dax/endofmonth-function-dax