PL-300: Microsoft Power BI Data Analyst
Which of the following functions returns a table?
TOPN
FILTER
DATEADD
All of the above
Answer is All of the above
All of these functions return tables.
Which of the following is NOT true about CALCULATE modifiers?
They are used to change filter context
They are used to access inactive table relationships
They allow you to drag and drop fields rather than write DAX from scratch
They are used to change the way filters propagate
Answer is They allow you to drag and drop fields rather than write DAX from scratch
Quick measures allow you to drag and drop fields rather than write DAX from scratch. The rest are all use cases for CALCULATE modifiers.
Which of the following functions allows you to calculate running totals?
DATESYTD
DATEADD
DATESINPERIOD
All of the above
Answer is DATESINPERIOD
DATESINPERIOD allows you to calculate running totals. DATESYTD is allows you to calculate performance to-date, and DATEADD allows you to calculate for a previous period.
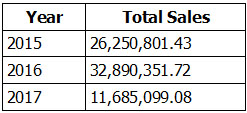
You have a table named Sales. Sales contains the data shown in the following table.

You have the following measure.
Total Sales This Year = SUM([Total Sales])
You plan to create a KPI to compare the current yearly sales to the previous year as shown in the exhibit.

You need to create the measure for the goal.
How should you complete the DAX formula?

Answer is CALCULATE - DATEADD
References:
https://msdn.microsoft.com/query-bi/dax/dateadd-function-dax
You have a Power BI model that contains the following two tables:
- Sales(Sales_ID, sales_date, sales_amount, CustomerID)
- Customer(CustomerID, First_name, Last_name)
There is a relationship between Sales and Customer.
You need to create a measure to rank the customers based on their total sales amount.
Which DAX formula should you use?
RANKX(ALL(Sales), SUMX(RELATEDTABLE(Customer), [Sales_amount]))
TOPN(ALL(customer), SUMX(RELATEDTABLE(Sales), [Sales_amount]))
RANKX(ALL(customer), SUMX(RELATEDTABLE(Sales), [Sales_amount]))
RANK.EQ(Sales[sales_amount], Customer[CustomerID])
Answer is RANKX(ALL(customer), SUMX(RELATEDTABLE(Sales), [Sales_amount]))
You need to rank customers on the basis of sale amount and not sale
References:
https://msdn.microsoft.com/query-bi/dax/rankx-function-dax
https://community.powerbi.com/t5/Desktop/RANKX-function-with-ALL/td-p/660999
You have a Power BI model that contains the following two tables:
- Sales (Sales_ID, DateID, sales_amount)
- Date(DateID, Date, Month, Week, Year)
The tables have a relationship.
You need to create a measure to calculate the sales for same period from the previous year.
Which DAX formula should you use?
SUM(sales[sales_amount]) - CALCULATE(SUM(sales[sales_amount]), DATESYID('Date'[Date]))
CALCULATE(SUM(sales[sales_amount]), SAMEPERIODLASTYEAR('Date'[Date]))
SUM(sales[sales_amount]) "" CALCULATE(SUM(sales[sales_amount]), SAMEPERIODLASTYEAR('Date'[Date]))
CALCULATEx(SUM(sales(sales_amount]), DATESYID('Date'[Date]))
Answer is CALCULATE(SUM(sales[sales_amount]), SAMEPERIODLASTYEAR('Date'[Date]))
References:
https://docs.microsoft.com/en-us/dax/sameperiodlastyear-function-dax#example
https://msdn.microsoft.com/en-us/library/ee634825.aspx
https://docs.microsoft.com/en-us/power-bi/desktop-quickstart-learn-dax-basics
https://msdn.microsoft.com/en-us/library/ee634972.aspx
You have a Power BI model that has a date table. A sample of the data shown in the following table.

You need to add a column to display the date in the format of December 01, 2014.
Which DAX formula should you use in Power BI Desktop?
FORMAT([Date], "MMM") & " " & FORMAT([Date], "DD") & ", " & FORMAT([Date], "YYYY")
FORMAT([Date], "M") & " " & FORMAT([Date], "D") & ", " & [Date].[Year])
[Date].[Month] & " " & FORMAT([Date], "D") & ", " & [Date].[Year])
FORMAT([Date], "MMMM DD, YYYY")
Answer is FORMAT([Date], "MMMM DD, YYYY")
FORMAT function using “MMM” produces the short name version of month (eg. Jan, Feb, Mar etc.). If the full month name is required, simply replace “MMM” with “MMMM”
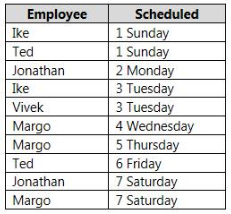
You are creating a work schedule for a retail store.
You have the following data from a query named Schedule.

You need to visualize the data as shown in the following exhibit.

You add a matrix visualization, and then you add Employee to the rows and Scheduled to columns.
Which DAX formula should you use to create the measure that will display the checkboxes?

Answer is Schedule Display = IF(COUNTROWS(Schedule) > 0, UNICHAR(9635)," ")
COUNTX(table,expression)
COUNTAX(table,expression)
COUNTROWS(table)
COUNTA(column)
COUNT(column)
You have a property named FactInternetSales used by several Power BI reports. The query is shown in the exhibit.

You plan to create a bar chart showing the count of sales by year that have a SalesAmount greater than $1,000.
You need to create a measure that will be used in the bar chart.
How should you complete the DAX formula?

Answer is COUNTROWS and FILTER
COUNTROWS(FILTER('Europe','Europe'[City]= "UK - London"))
Alternate:
COUNTX(Europe,FILTER(Europe,Europe[City] = "UK - London"))
You have a Power BI model for sales data. You create a measure to calculate the year-to-date sales.
You need to compare the year-to-date sales with the previous year for the same time period.
Which DAX function should you use?
LASTDATE
TOTALYTD
SAMEPERIODLASTYEAR
PREVIOUSYEAR
DATEADD
F. DATESVTD
Answer is SAMEPERIODLASTYEAR
1st already existing measure to calculate ytd sales:
YtdSales = CALCULATE(SUM(FactInternetSales[SalesAmount]), DATESYTD(FactInternetSales[DueDate]))
To be able to compare you need to create a 2nd measure to calculate ytd sales same period previous year:
YtdSalesSamePeriodLastYear = CALCULATE([YtdSales], SAMEPERIODLASTYEAR(FactInternetSales[DueDate]))