DP-100: Designing and Implementing a Data Science Solution on Azure
You are performing a filter-based feature selection for a dataset to build a multi-class classifier by using Azure Machine Learning Studio.
The dataset contains categorical features that are highly correlated to the output label column.
You need to select the appropriate feature scoring statistical method to identify the key predictors.
Which method should you use?
Kendall correlation
Spearman correlation
Chi-squared
Pearson correlation
Answer is Chi-squared
Your choice of a filter selection method depends in part on what sort of input data you have. The requirement for all Pearson Correlation, Spearman Correlation and Fisher Score methods is "features must be numeric". But for Chi Squared, the requirement is "features can be text or numeric" so you can use this method for computing feature importance for categorical columns.
Reference:
https://docs.microsoft.com/en-us/azure/machine-learning/studio-module-reference/filter-based-feature-selection
You create a binary classification model to predict whether a person has a disease.
You need to detect possible classification errors.
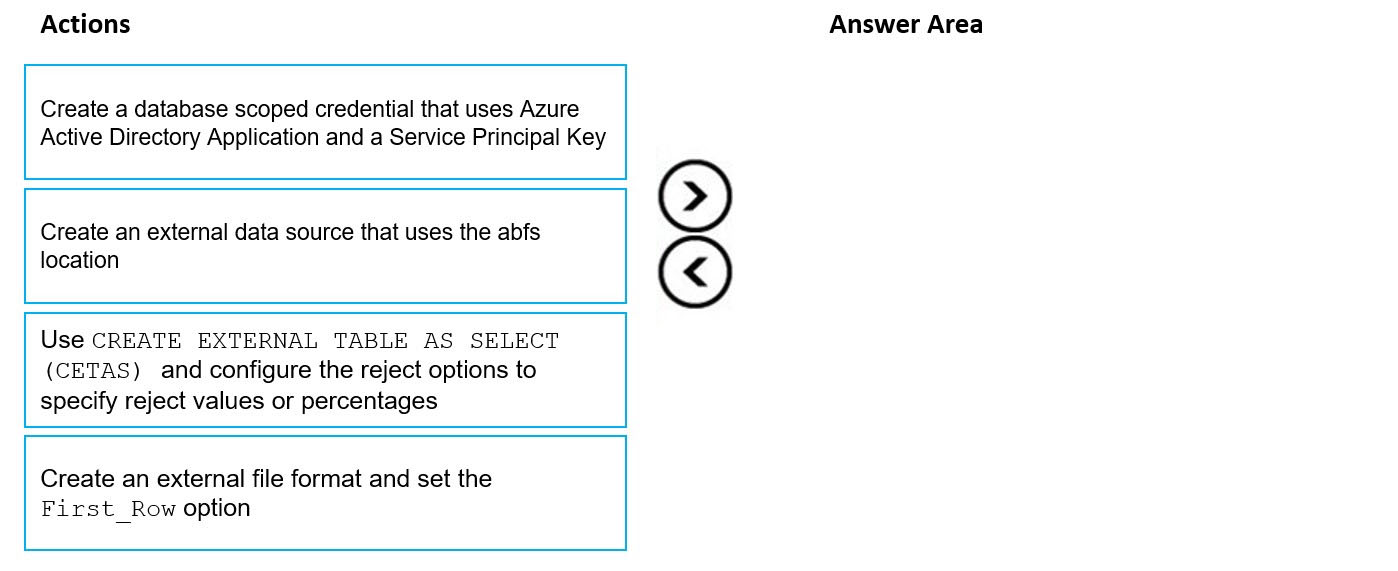
Which error type should you choose for each description?
A - B - C - D
C - D - A - B
B - A - C - D
D - A - B - C
B - D - A - C
A - D - C - B
C - B - D - A
D - C - B - A
Box 1: True Positive
A true positive is an outcome where the model correctly predicts the positive class
Box 2: True Negative
A true negative is an outcome where the model correctly predicts the negative class.
Box 3: False Positive
A false positive is an outcome where the model incorrectly predicts the positive class.
Box 4: False Negative
A false negative is an outcome where the model incorrectly predicts the negative class.
Note: Let's make the following definitions:
"Wolf" is a positive class.
"No wolf" is a negative class.
We can summarize our "wolf-prediction" model using a 2x2 confusion matrix that depicts all four possible outcomes:
Reference:
https://developers.google.com/machine-learning/crash-course/classification/true-false-positive-negative
You are using the Azure Machine Learning Service to automate hyperparameter exploration of your neural network classification model.
You must define the hyperparameter space to automatically tune hyperparameters using random sampling according to following requirements:
- The learning rate must be selected from a normal distribution with a mean value of 10 and a standard deviation of 3.
- Batch size must be 16, 32 and 64.
- Keep probability must be a value selected from a uniform distribution between the range of 0.05 and 0.1.
You need to use the param_sampling method of the Python API for the Azure Machine Learning Service.
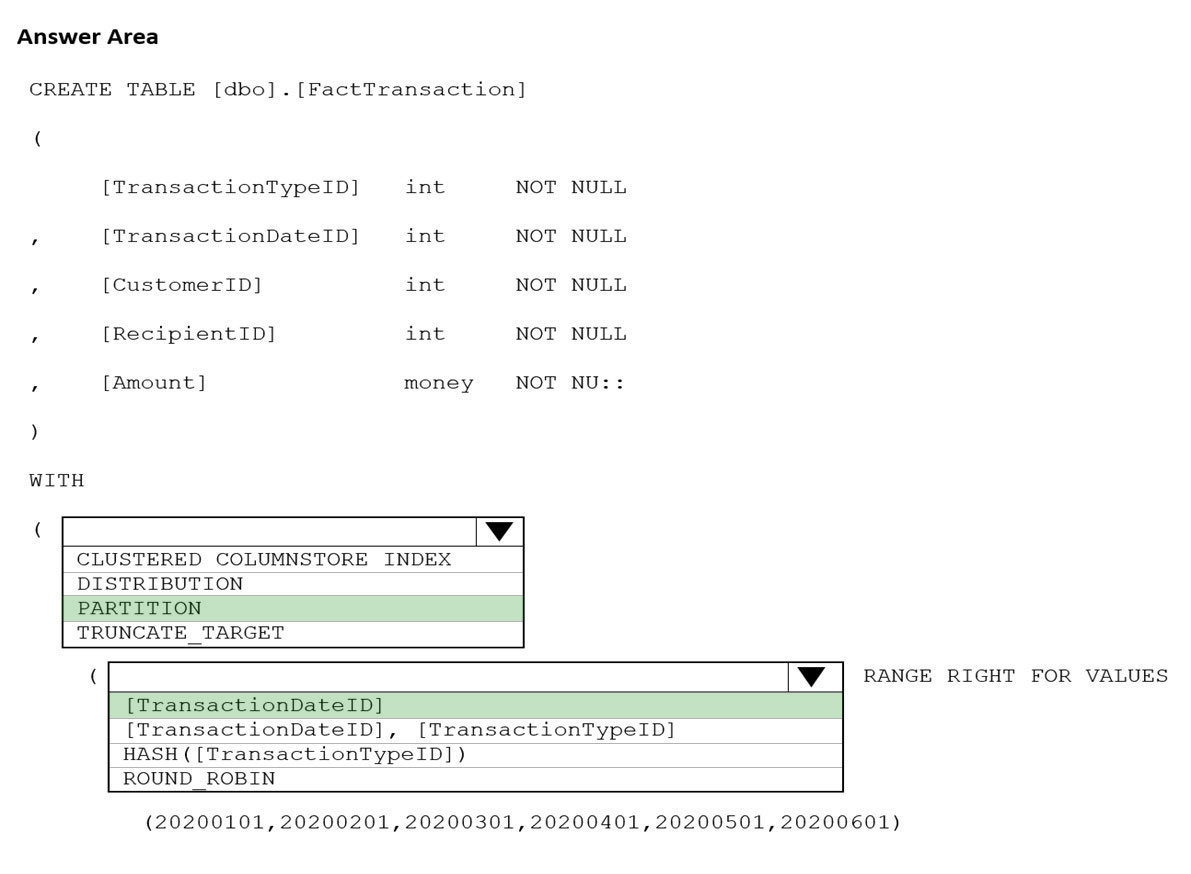
How should you complete the code segment?
A - B - C
A - C - B
B - A - B
B - C - A
C - A - B
C - B - A
D - A - B
D - B - C
Answer is B - A - B
In random sampling, hyperparameter values are randomly selected from the defined search space. Random sampling allows the search space to include both discrete and continuous hyperparameters.
Example:
from azureml.train.hyperdrive import RandomParameterSampling
param_sampling = RandomParameterSampling( {
   "learning_rate": normal(10, 3),
   "keep_probability": uniform(0.05, 0.1),
   "batch_size": choice(16, 32, 64)
}
Reference:
https://docs.microsoft.com/en-us/azure/machine-learning/service/how-to-tune-hyperparameters
You are creating a new experiment in Azure Machine Learning Studio. You have a small dataset that has missing values in many columns. The data does not require the application of predictors for each column. You plan to use the Clean Missing Data.
You need to select a data cleaning method.
Which method should you use?
Replace using Probabilistic PCA
Normalization
Synthetic Minority Oversampling Technique (SMOTE)
Replace using MICE
Answer is Replace using Probabilistic PCA
Replace using Probabilistic PCA: Compared to other options, such as Multiple Imputation using Chained Equations (MICE), this option has the advantage of not requiring the application of predictors for each column. Instead, it approximates the covariance for the full dataset. Therefore, it might offer better performance for datasets that have missing values in many columns.
References:
https://docs.microsoft.com/en-us/azure/machine-learning/studio-module-reference/clean-missing-data
You are evaluating a completed binary classification machine learning model.
You need to use the precision as the evaluation metric.
Which visualization should you use?
violin plot
Gradient descent
Scatter plot
Receiver Operating Characteristic (ROC) curve
Answer is Receiver Operating Characteristic (ROC) curve
Receiver operating characteristic (or ROC) is a plot of the correctly classified labels vs. the incorrectly classified labels for a particular model.
Incorrect Answers:
A: A violin plot is a visual that traditionally combines a box plot and a kernel density plot.
B: Gradient descent is a first-order iterative optimization algorithm for finding the minimum of a function. To find a local minimum of a function using gradient descent, one takes steps proportional to the negative of the gradient (or approximate gradient) of the function at the current point.
C: A scatter plot graphs the actual values in your data against the values predicted by the model. The scatter plot displays the actual values along the X-axis, and displays the predicted values along the Y-axis. It also displays a line that illustrates the perfect prediction, where the predicted value exactly matches the actual value.
References:
https://docs.microsoft.com/en-us/azure/machine-learning/how-to-understand-automated-ml#confusion-matrix
You have a dataset created for multiclass classification tasks that contains a normalized numerical feature set with 10,000 data points and 150 features.
You use 75 percent of the data points for training and 25 percent for testing. You are using the scikit-learn machine learning library in Python. You use X to denote the feature set and Y to denote class labels.
You create the following Python data frames:
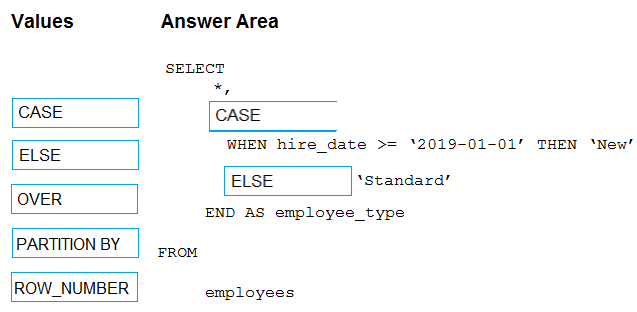
You need to apply the Principal Component Analysis (PCA) method to reduce the dimensionality of the feature set to 10 features in both training and testing sets.
How should you complete the code segment?

A - B - C
A - C - B
C - A - D
B - C - A
C - A - B
C - B - D
D - A - B
D - B - C
Answer is C - A - D
Box 1: PCA(n_components = 10) Need to reduce the dimensionality of the feature set to 10 features in both training and testing sets.
Example:
from sklearn.decomposition import PCA
pca = PCA(n_components=2); 2 dimensions
principalComponents = pca.fit_transform(x)
Box 2: pca
fit_transform(X[, y])fits the model with X and apply the dimensionality reduction on X.
Box 3: transform(x_test)
transform(X) applies dimensionality reduction to X.
References:
https://scikit-learn.org/stable/modules/generated/sklearn.decomposition.PCA.html
You have a feature set containing the following numerical features: X, Y, and Z.
The Poisson correlation coefficient (r-value) of X, Y, and Z features is shown in the following image:
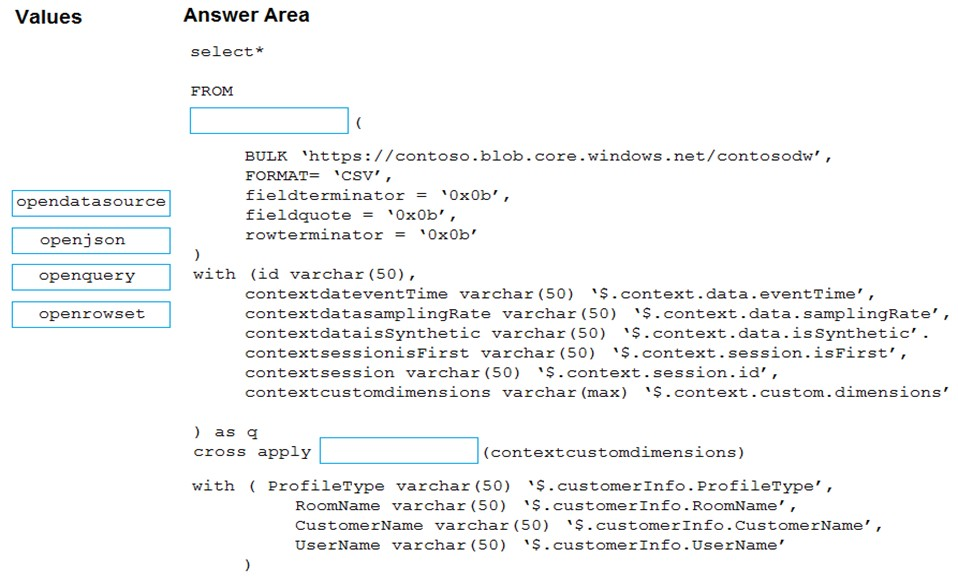
Use the drop-down menus to select the answer choice that answers each question based on the information presented in the graphic.
A - B
A - C
B - A
B - C
C - A
C - B
D - A
D - B
Answer is C - A
Box 1: 0.859122
Box 2: a positively linear relationship
+1 indicates a strong positive linear relationship
-1 indicates a strong negative linear correlation
0 denotes no linear relationship between the two variables.
References:
https://docs.microsoft.com/en-us/azure/machine-learning/studio-module-reference/compute-linear-correlation
You are performing feature scaling by using the scikit-learn Python library for x.1 x2, and x3 features.
Original and scaled data is shown in the following image.

Use the drop-down menus to select the answer choice that answers each question based on the information presented in the graphic.

A - B - C
A - C - B
B - A - B
B - C - A
C - A - B
C - B - A
Answer is A - B - C
Box 1: Standard Scaler
The StandardScaler assumes your data is normally distributed within each feature and will scale them such that the distribution is now centred around 0, with a standard deviation of 1.
Example:
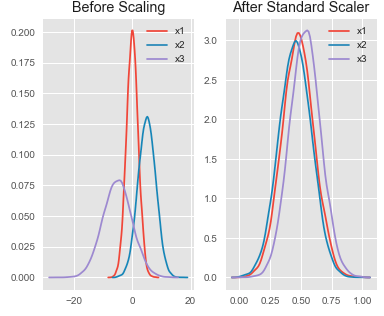
All features are now on the same scale relative to one another.
Box 2: Min Max Scaler
Notice that the skewness of the distribution is maintained but the 3 distributions are brought into the same scale so that they overlap.
Box 3: Normalizer
References:
http://benalexkeen.com/feature-scaling-with-scikit-learn/
You are producing a multiple linear regression model in Azure Machine Learning Studio.
Several independent variables are highly correlated.
You need to select appropriate methods for conducting effective feature engineering on all the data.
Which three actions should you perform in sequence?
Evaluate the probability function
Remove dublicate rows
Use the Filter Based Feature Selection module
Test the hypothesis using t-Test
Compute linear correlation
Build a counting transform
In real exam, order of your answers is also important.
Step 1: Use the Filter Based Feature Selection module
Filter Based Feature Selection identifies the features in a dataset with the greatest predictive power.
The module outputs a dataset that contains the best feature columns, as ranked by predictive power. It also outputs the names of the features and their scores from the selected metric.
Step 2: Build a counting transform
A counting transform creates a transformation that turns count tables into features, so that you can apply the transformation to multiple datasets.
Step 3: Test the hypothesis using t-Test
References:
https://docs.microsoft.com/bs-latn-ba/azure/machine-learning/studio-module-reference/filter-based-feature-selection
https://docs.microsoft.com/en-us/azure/machine-learning/studio-module-reference/build-counting-transform
You are creating a model to predict the price of a student's artwork depending on the following variables: the student's length of education, degree type, and art form.
You start by creating a linear regression model.
You need to evaluate the linear regression model.
Solution: Use the following metrics: Accuracy, Precision, Recall, F1 score, and AUC.
Does the solution meet the goal?
Yes
No
Answer is No
Those are metrics for evaluating classification models, instead use: Mean Absolute Error, Root Mean Absolute Error, Relative Absolute Error, Relative Squared Error, and the Coefficient of Determination.
References:
https://docs.microsoft.com/en-us/azure/machine-learning/studio-module-reference/evaluate-model