DP-100: Designing and Implementing a Data Science Solution on Azure
You are retrieving data from a large datastore by using Azure Machine Learning Studio.
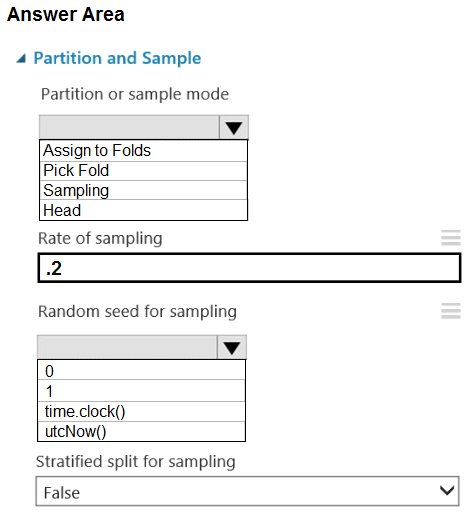
You must create a subset of the data for testing purposes using a random sampling seed based on the system clock.
You add the Partition and Sample module to your experiment.
You need to select the properties for the module.
Which values should you select?
Assign to Folds - 0
Pick Fold - 0
Sampling - 0
Head - 0
Assign to Folds - time.clock()
Head - 1
Sampling - utcNow()
Pick Fold - 1
Box 1: Sampling
Create a sample of data
This option supports simple random sampling or stratified random sampling. This is useful if you want to create a smaller representative sample dataset for testing.
1. Add the Partition and Sample module to your experiment in Studio, and connect the dataset.
2. Partition or sample mode: Set this to Sampling.
3. Rate of sampling. See the answer below.
Box 2: 0
3. Rate of sampling. Random seed for sampling: Optionally, type an integer to use as a seed value.
This option is important if you want the rows to be divided the same way every time. The default value is 0, meaning that a starting seed is generated based on the system clock. This can lead to slightly different results each time you run the experiment.
References:
https://docs.microsoft.com/en-us/azure/machine-learning/studio-module-reference/partition-and-sample
You are analyzing a raw dataset that requires cleaning.
You must perform transformations and manipulations by using Azure Machine Learning Studio.
You need to identify the correct modules to perform the transformations.
Which modules should you choose?
In real exam, you may need to drag the split bar between panes or scroll to view content.
| Answer Options | Answer Area | |||
| A | Clean missing data | ? | Replace missing values by removing rows and columns. | |
| B | SMOTE | ? | Increase the number of low-incidence examples in the dataset. | |
| C | Convert to Indicator Values | ? | Convert a categorical feature into a binary indicator. | |
| D | Remove Dublicate Rows | ? | Remove potential dublicates from a dataset. | |
| E | Threshold Filter |
A-B-C-D
B-A-D-C
D-C-B-A
C-D-B-A
B-D-A-C
B-A-C-D
A-C-D-B
Box 1: Clean Missing Data
Box 2: SMOTE
Use the SMOTE module in Azure Machine Learning Studio to increase the number of underepresented cases in a dataset used for machine learning. SMOTE is a better way of increasing the number of rare cases than simply duplicating existing cases.
Box 3: Convert to Indicator Values
Use the Convert to Indicator Values module in Azure Machine Learning Studio. The purpose of this module is to convert columns that contain categorical values into a series of binary indicator columns that can more easily be used as features in a machine learning model.
Box 4: Remove Duplicate Rows
References:
https://docs.microsoft.com/en-us/azure/machine-learning/studio-module-reference/smote
https://docs.microsoft.com/en-us/azure/machine-learning/studio-module-reference/convert-to-indicator-values
You have a Python data frame named salesData in the following format:
The data frame must be unpivoted to a long data format as follows:
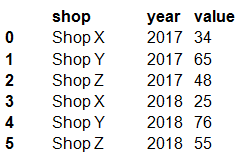
You need to use the pandas.melt() function in Python to perform the transformation.
How should you complete the code segment? To answer, select the appropriate options in the answer area.
dataFrame - shop - 'shop'
dataFrame - shop - ['year']
dataFrame - shop - ['2017','2018']
pandas - year - 'year'
pandas - value - 'year'
salesData - shop X, shop Y, shop Z - ['2017','2018']
year - value - 'shop'
year - shop X, shop Y, shop Z - ['year']
Box 1: dataFrame
Syntax: pandas.melt(frame, id_vars=None, value_vars=None, var_name=None, value_name='value', col_level=None)[source]
Box 2: shop
Paramter id_vars id_vars : tuple, list, or ndarray, optional
Column(s) to use as identifier variables.
Box 3: ['2017','2018']
value_vars : tuple, list, or ndarray, optional
Column(s) to unpivot. If not specified, uses all columns that are not set as id_vars.
You are working on a classification task. You have a dataset indicating whether a student would like to play soccer and associated attributes. The dataset includes the following columns:

You need to classify variables by type.
Which variable should you add to each category?
Gender, IsPlaySoccer - Gender, IsPlaySoccer
Gender, IsPlaySoccer - PrevExamMarks, Height, Weight
Gender, PrevExamMarks, Height, Weight - PrevExamMarks, Height, Weight
Gender, PrevExamMarks, Height, Weight - IsPlaySoccer
PrevExamMarks, Height, Weight - Gender, IsPlaySoccer
PrevExamMarks, Height, Weight - IsPlaySoccer
IsPlaySoccer - Gender, PrevExamMarks, Height, Weight
IsPlaySoccer - PrevExamMarks, Height, Weight
Selections are Gender, IsPlaySoccer and PrevExamMarks, Height, Weight
References:
https://www.edureka.co/blog/classification-algorithms/
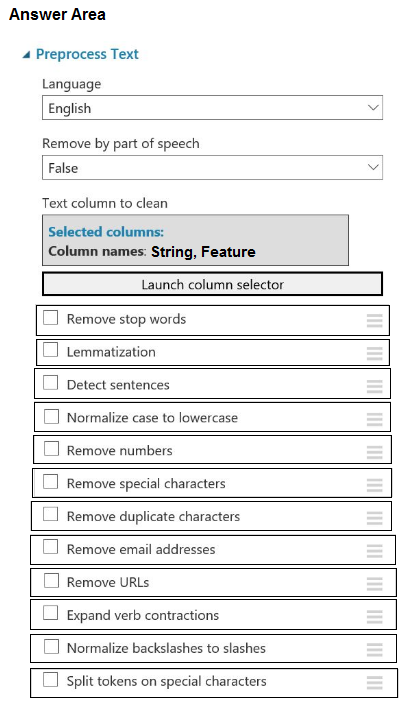
You plan to preprocess text from CSV files. You load the Azure Machine Learning Studio default stop words list.
You need to configure the Preprocess Text module to meet the following requirements:
- Ensure that multiple related words from a single canonical form.
- Remove pipe characters from text.
Remove words to optimize information retrieval.
Which three options should you select?
Remove stop words
Lemmatization
Detect sentences
Normalize case to lowercase
Remove numbers
Remove special characters
Remove dublicate characters
Remove email addresses
Box 1: Remove stop words
Remove words to optimize information retrieval.
Remove stop words: Select this option if you want to apply a predefined stopword list to the text column. Stop word removal is performed before any other processes.
Box 2: Lemmatization
Ensure that multiple related words from a single canonical form.
Lemmatization converts multiple related words to a single canonical form
Box 3: Remove special characters
Remove special characters: Use this option to replace any non-alphanumeric special characters with the pipe | character.
References:
https://docs.microsoft.com/en-us/azure/machine-learning/studio-module-reference/preprocess-text
You are a data scientist using Azure Machine Learning Studio.
You need to normalize values to produce an output column into bins to predict a target column.
Solution: Apply a Quantiles normalization with a QuantileIndex normalization.
Does the solution meet the goal?
Yes
No
Answer is No
Use the Entropy MDL binning mode which has a target column.
References:
https://docs.microsoft.com/en-us/azure/machine-learning/studio-module-reference/group-data-into-bins
You are creating a new experiment in Azure Machine Learning Studio.
One class has a much smaller number of observations than the other classes in the training set.
You need to select an appropriate data sampling strategy to compensate for the class imbalance.
Solution: You use the Stratified split for the sampling mode.
Does the solution meet the goal?
Yes
No
Answer is No
Instead use the Synthetic Minority Oversampling Technique (SMOTE) sampling mode.
Note: SMOTE is used to increase the number of underepresented cases in a dataset used for machine learning. SMOTE is a better way of increasing the number of rare cases than simply duplicating existing cases.
References:
https://docs.microsoft.com/en-us/azure/machine-learning/studio-module-reference/smote
You are evaluating a completed binary classification machine learning model.
You need to use the precision as the evaluation metric.
Which visualization should you use?
Violin plot
Gradient descent
Box plot
Binary classification confusion matrix
Answer is Binary classification confusion matrix
Incorrect Answers:
A: A violin plot is a visual that traditionally combines a box plot and a kernel density plot.
B: Gradient descent is a first-order iterative optimization algorithm for finding the minimum of a function. To find a local minimum of a function using gradient descent, one takes steps proportional to the negative of the gradient (or approximate gradient) of the function at the current point.
C: A box plot lets you see basic distribution information about your data, such as median, mean, range and quartiles but doesn't show you how your data looks throughout its range.
References:
https://machinelearningknowledge.ai/confusion-matrix-and-performance-metrics-machine-learning/
You have a dataset that contains over 150 features. You use the dataset to train a Support Vector Machine (SVM) binary classifier.
You need to use the Permutation Feature Importance module in Azure Machine Learning Studio to compute a set of feature importance scores for the dataset.
In which order should you perform the actions?
| Answer Options | Answer Area | ||
| A | Add a Two-Class Support Vector Machine module to initialize the SVM classifier. | ? | |
| B | Set the Metric for measuring performance property to Classification - Accuracy and then run the experiment. | ? | |
| C | Add a Permutation Feature Importance module and connect the trained model and test dataset. | ? | |
| D | Add a dataset to experiment. | ? | |
| E | Add a Split Data module to create training and test datasets. | ? |
A - B - C - D - E
A - D - C - B - E
A - D - E - B - C
A - D - E - C - B
A - D - E - C - B
E - D - A - C - B
E - B - A - B - D
E - C - B - A - D
Answer is A - D - E - C - B
Step 1: Add a Two-Class Support Vector Machine module to initialize the SVM classifier.
Step 2: Add a dataset to the experiment
Step 3: Add a Split Data module to create training and test dataset. To generate a set of feature scores requires that you have an already trained model, as well as a test dataset.
Step 4: Add a Permutation Feature Importance module and connect to the trained model and test dataset.
Step 5: Set the Metric for measuring performance property to Classification - Accuracy and then run the experiment.
Reference:
https://docs.microsoft.com/en-us/azure/machine-learning/studio-module-reference/two-class-support-vector-machine
https://docs.microsoft.com/en-us/azure/machine-learning/studio-module-reference/permutation-feature-importance
You are creating a machine learning model in Python. The provided dataset contains several numerical columns and one text column. The text column represents a product's category. The product category will always be one of the following:
- Bikes
- Cars
- Vans
- Boats
You are building a regression model using the scikit-learn Python package.
You need to transform the text data to be compatible with the scikit-learn Python package.
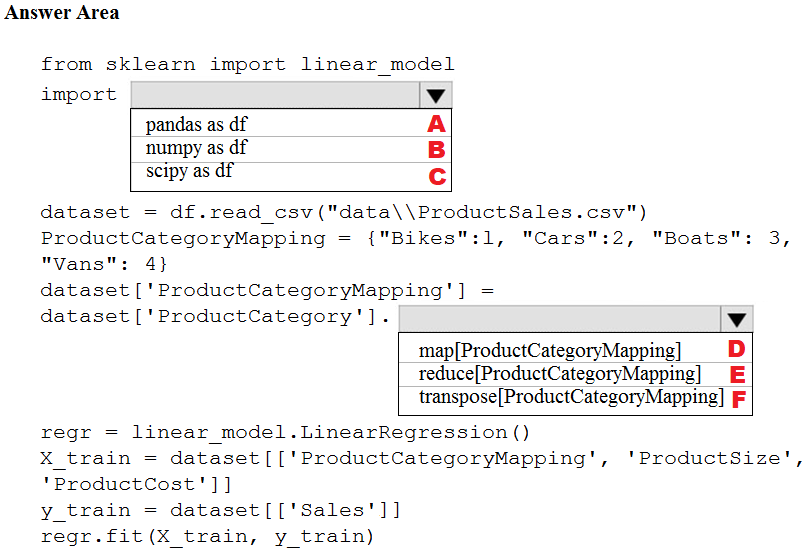
How should you complete the code segment?
A - D
A - E
A - F
B - D
B - E
B - F
C - D
C - E
Box 1: pandas as df
Pandas takes data (like a CSV or TSV file, or a SQL database) and creates a Python object with rows and columns called data frame that looks very similar to table in a statistical software (think Excel or SPSS for example.
Box 2: transpose[ProductCategoryMapping]
Reshape the data from the pandas Series to columns.
Reference:
https://datascienceplus.com/linear-regression-in-python/